
View portfolio overview
Portfolio details provides recent bill period information reflecting the accounts.
Access rolled up data that spans all accounts within the portfolio:
View aggregate usage and cost across the portfolio
Numerical values provide a high level summary of the aggregate values offering the key metrics at a glance
Interactive graphs enables drilling into data to further explore and investigate
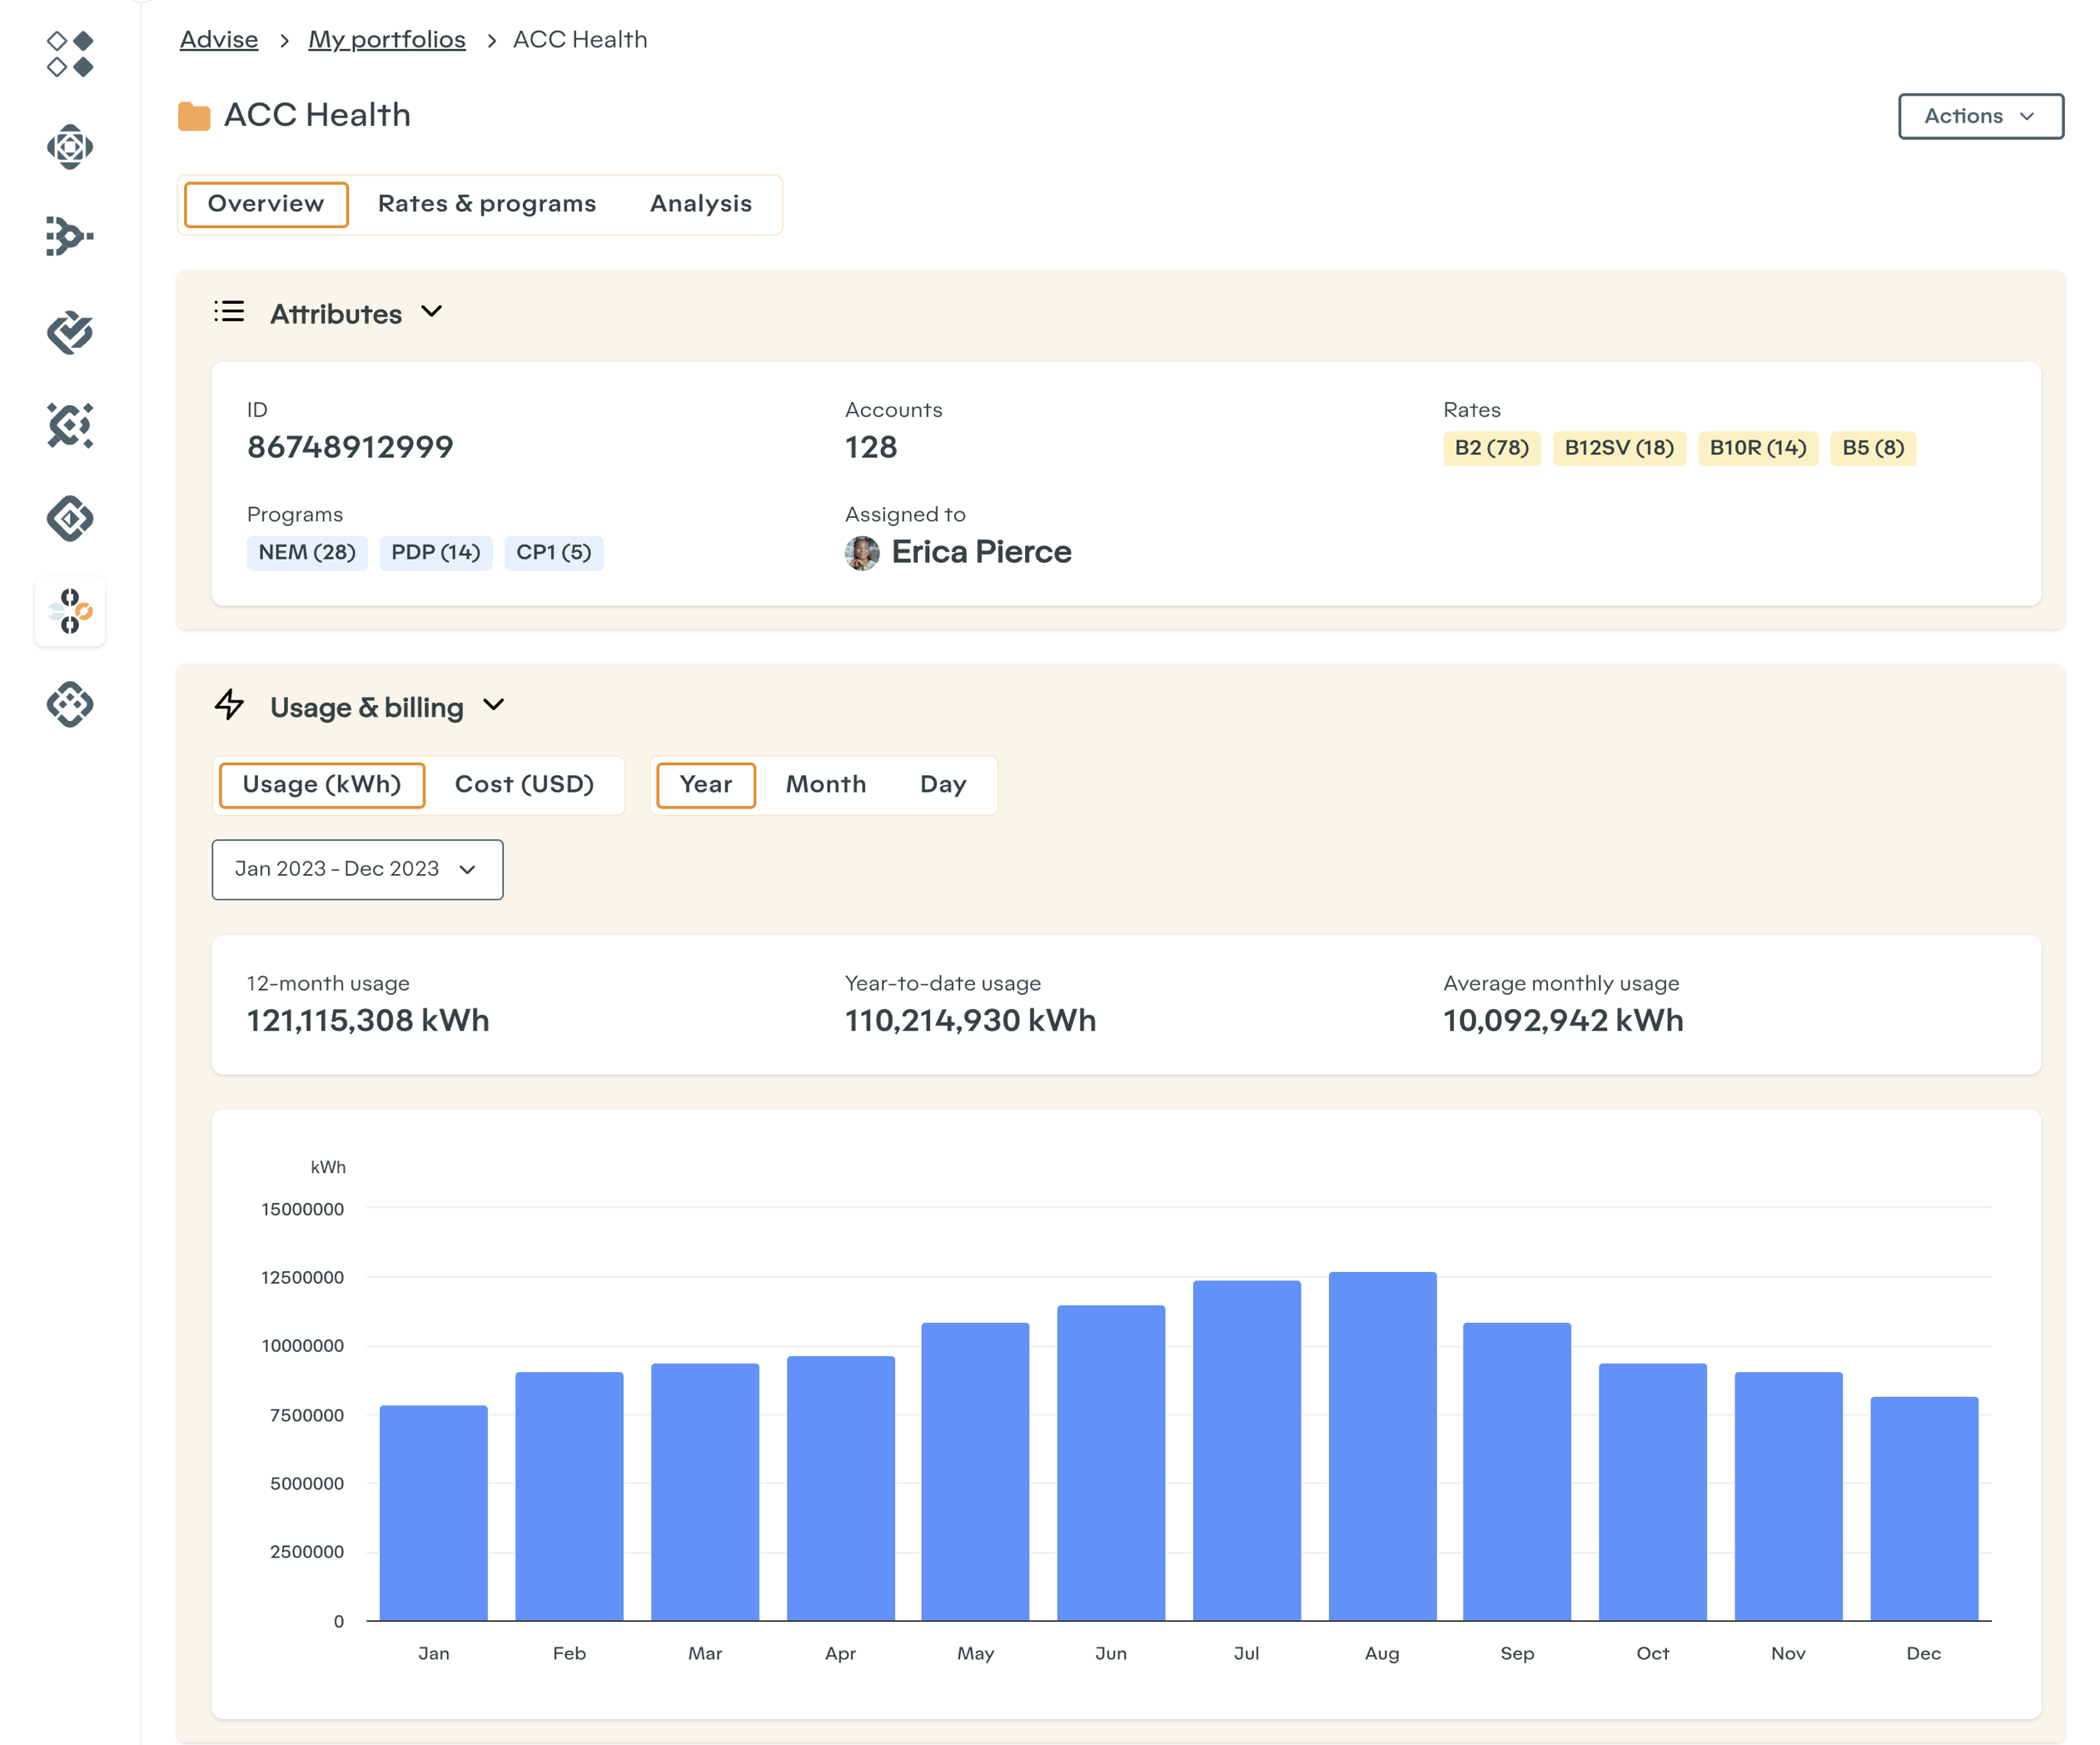
Portfolio overview view.
Usage and cost information supports single fuel or dual fuel scenarios
Chart view facilitates discovery of outliers as well as trends visually.
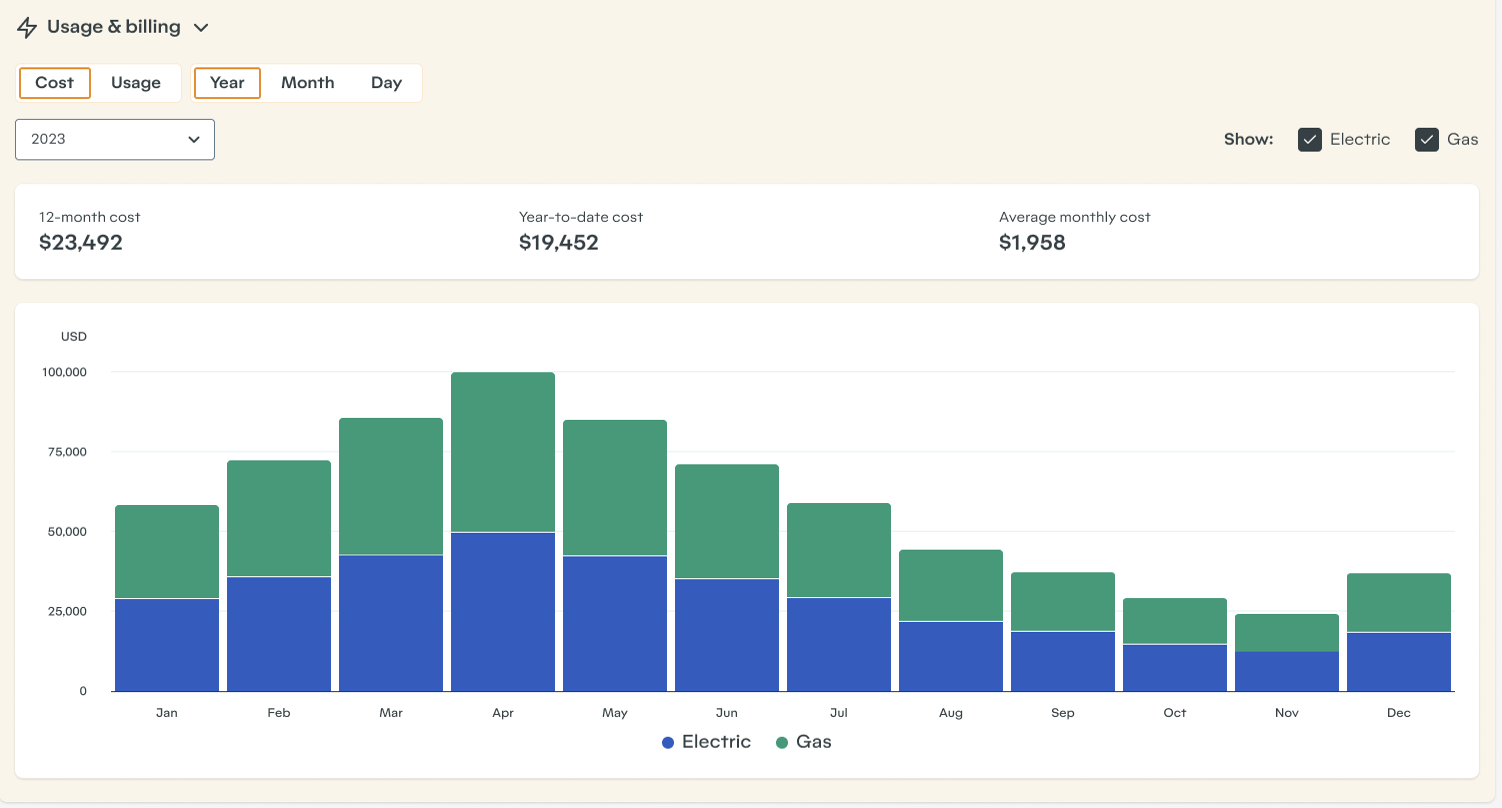
Chart view.
Account list shows all Accounts in a portfolio with valuable metrics for the most recent 12 month period to identify outliers or potential savings.
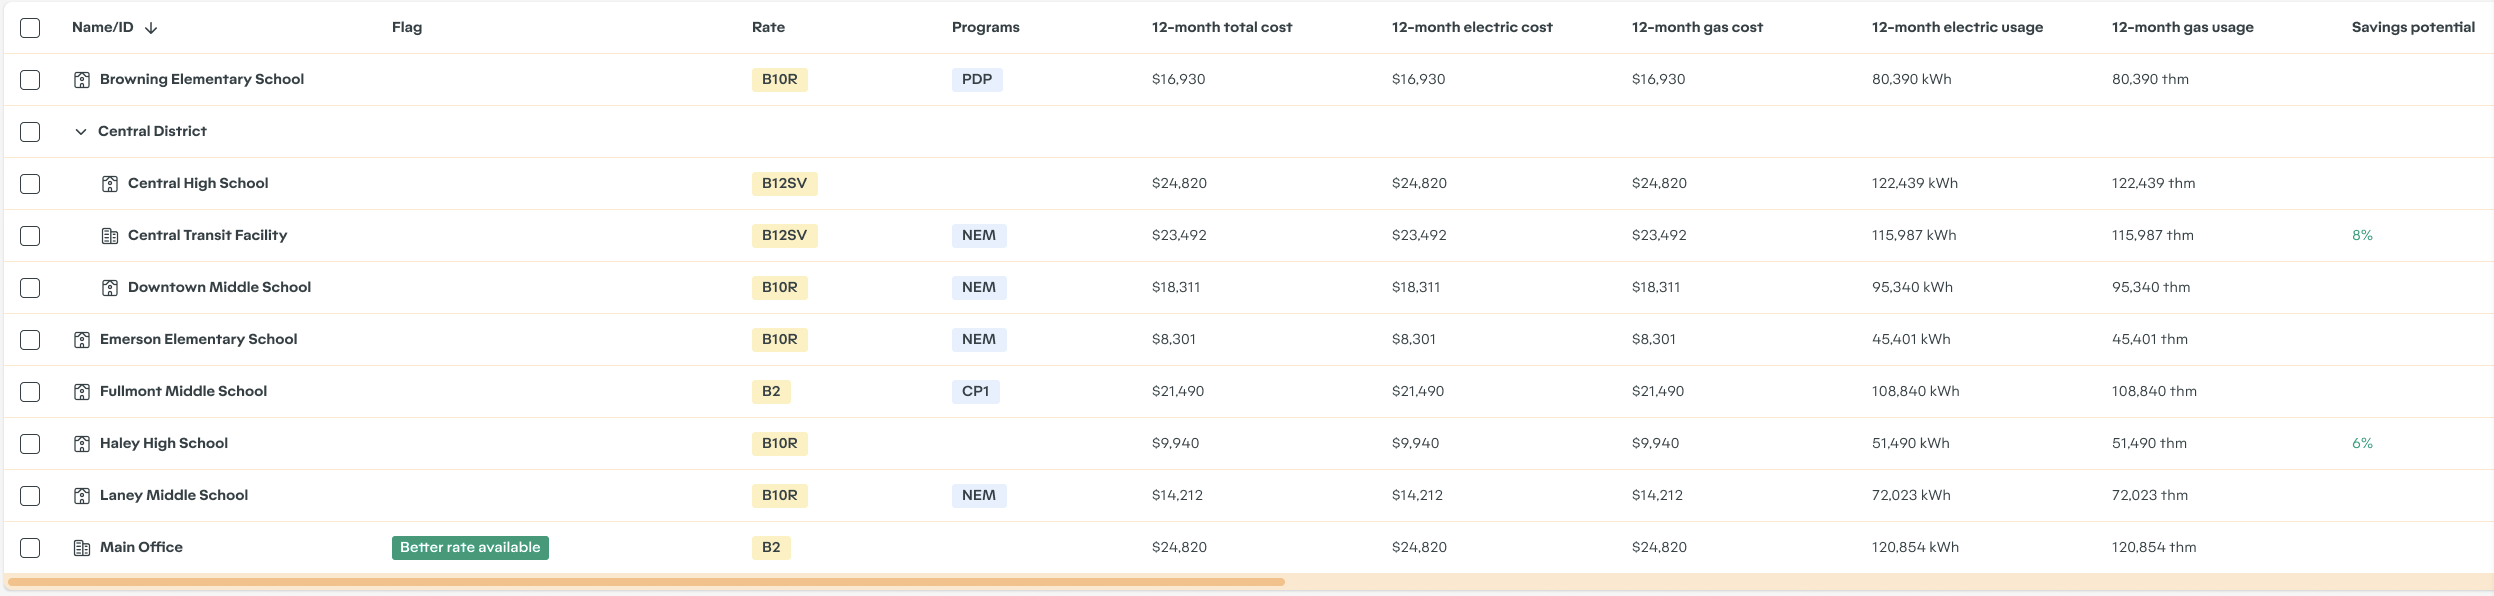
Account list view.
Summary of flagged accounts highlighted at the top of the Account view with a quick link to pull up those specific accounts
Account hierarchy displayed through a nested account list to quickly assess account relationships
Hierarchy can be configured manually, from data ingestion from the native Customer Information System (CIS) or a combination of both
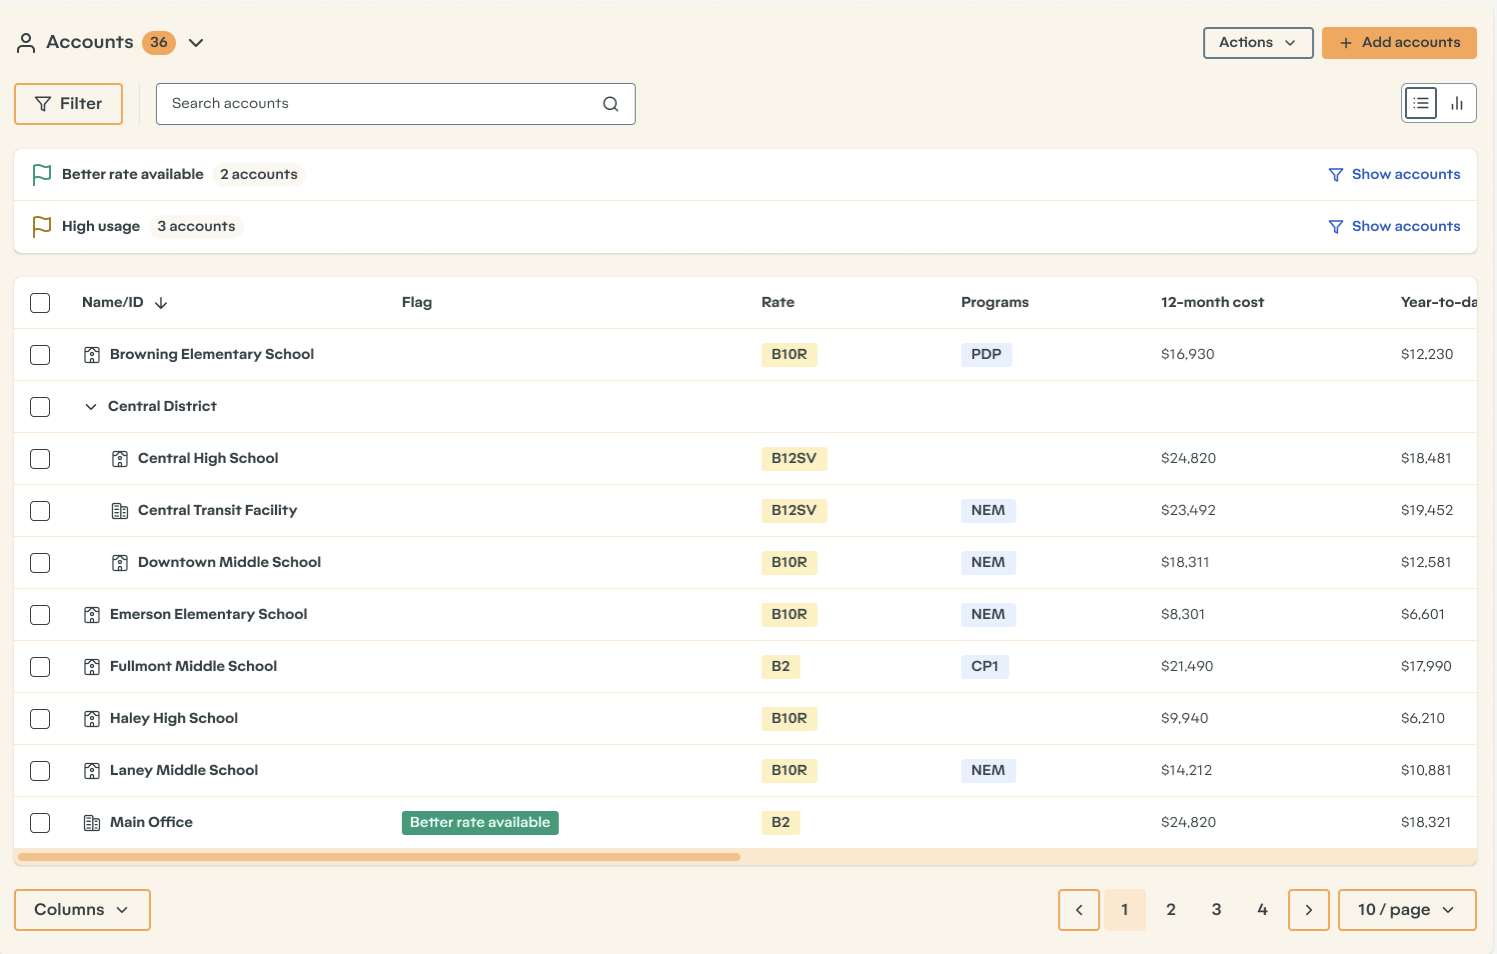
Account list view.