
Explore
Overview
GridX Explore  is an authenticated, customer-facing solution that enables users to create personalized what-if calculations that include adoption of DERs, changes in behavior, electrification strategies and more. The solution is intuitive and makes it easy to learn the financial costs and benefits of adopting behind-the-meter technologies. It provides accurate personalized estimates by applying the user’s historical usage data to forward-looking prices. Users can save their work, allowing them to compare multiple scenarios and take the time needed to consider these potentially expensive investments without losing progress. The utility can view customer-generated analyses and can use that information to do both distribution planning as well as more targeted marketing based on the customers’ expressed preferences.
Benefits include:
Increase adoption of clean energy technology by allowing customers to easily select technologies like solar, EVs and storage devices, and immediately see the cumulative bill impact of their energy scenarios.
Deliver personalized answers around cost and usage in real time as part of a seamless customer journey that accelerates the adoption of new and existing programs.
Give customers peace of mind by allowing them to assess whether other rate offerings can save them money, empowering users to make the right decision and increasing their satisfaction.
Create a modern e-commerce experience by enabling customers to save multiple energy scenarios in a ‘cart-like’ format, set reminders and trigger key steps in the enrollment path.
Enhance the utility’s trusted advisor status by providing one-of-a-kind, personalized analysis to customers and connecting them with incentives and rebates that lower the cost of clean energy technologies.
Calculation Workflow
GridX Explore allows users to create clean energy calculations using their historical usage data. Users select clean energy products like solar or EV which utilize GridX compareCalculate and modifier APIs to create forward-looking cost and usage estimates. The calculations also provide recommendations for the lowest cost rate and implementation tips which can be specified by the utility.
Landing Page & My Calculations
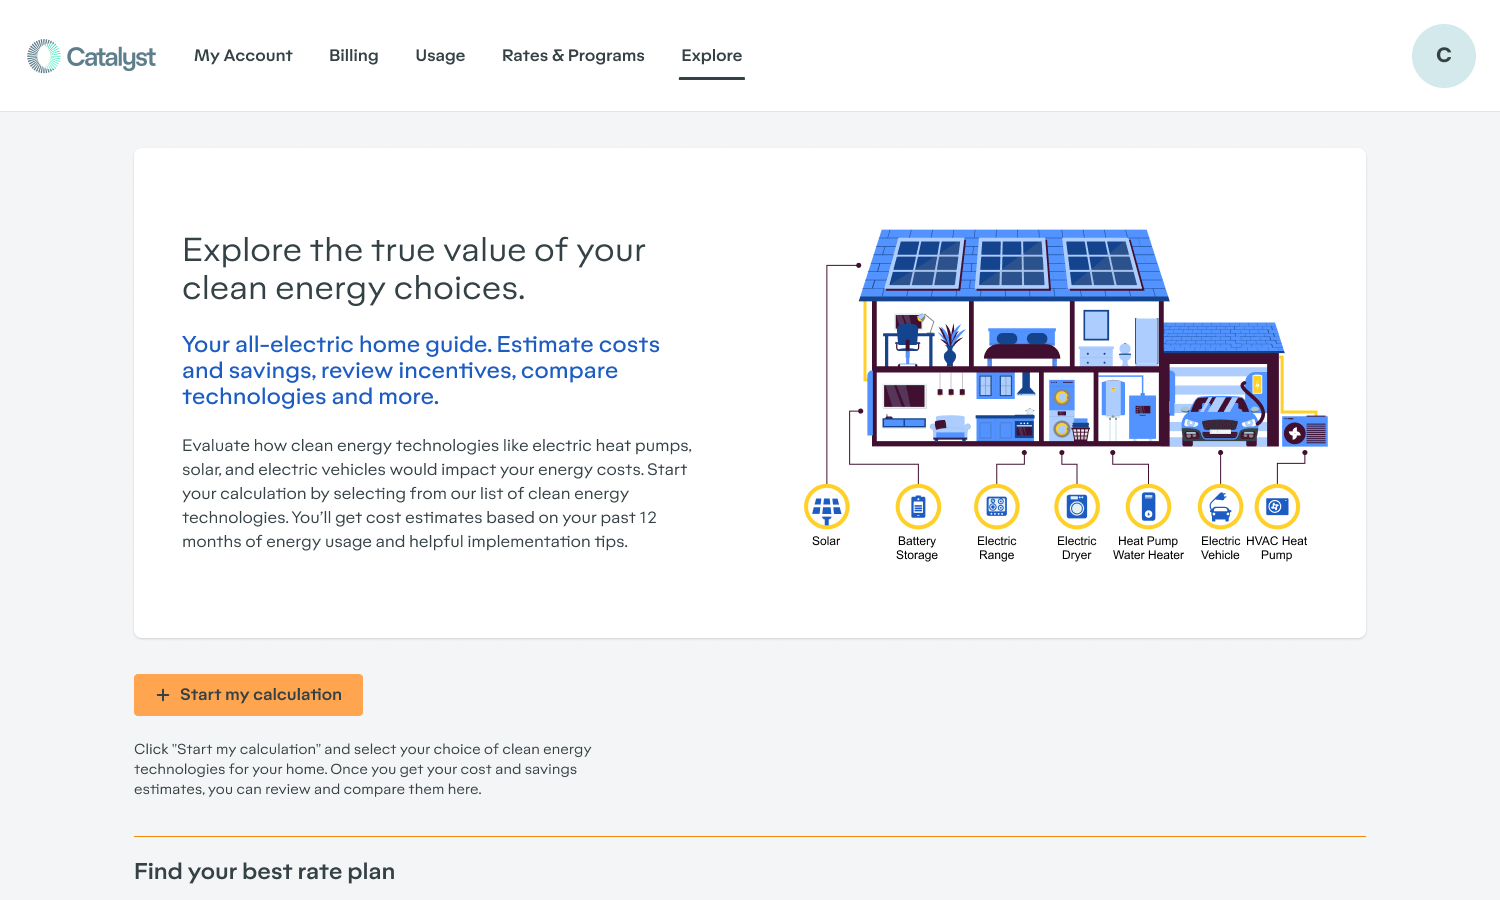
The landing page for GridX Explore includes an overview of the tool and a list of the user’s calculations. Overview content, including copy and header image can be customized by the utility. The landing page can be embedded anywhere in the utility website navigation after authentication.
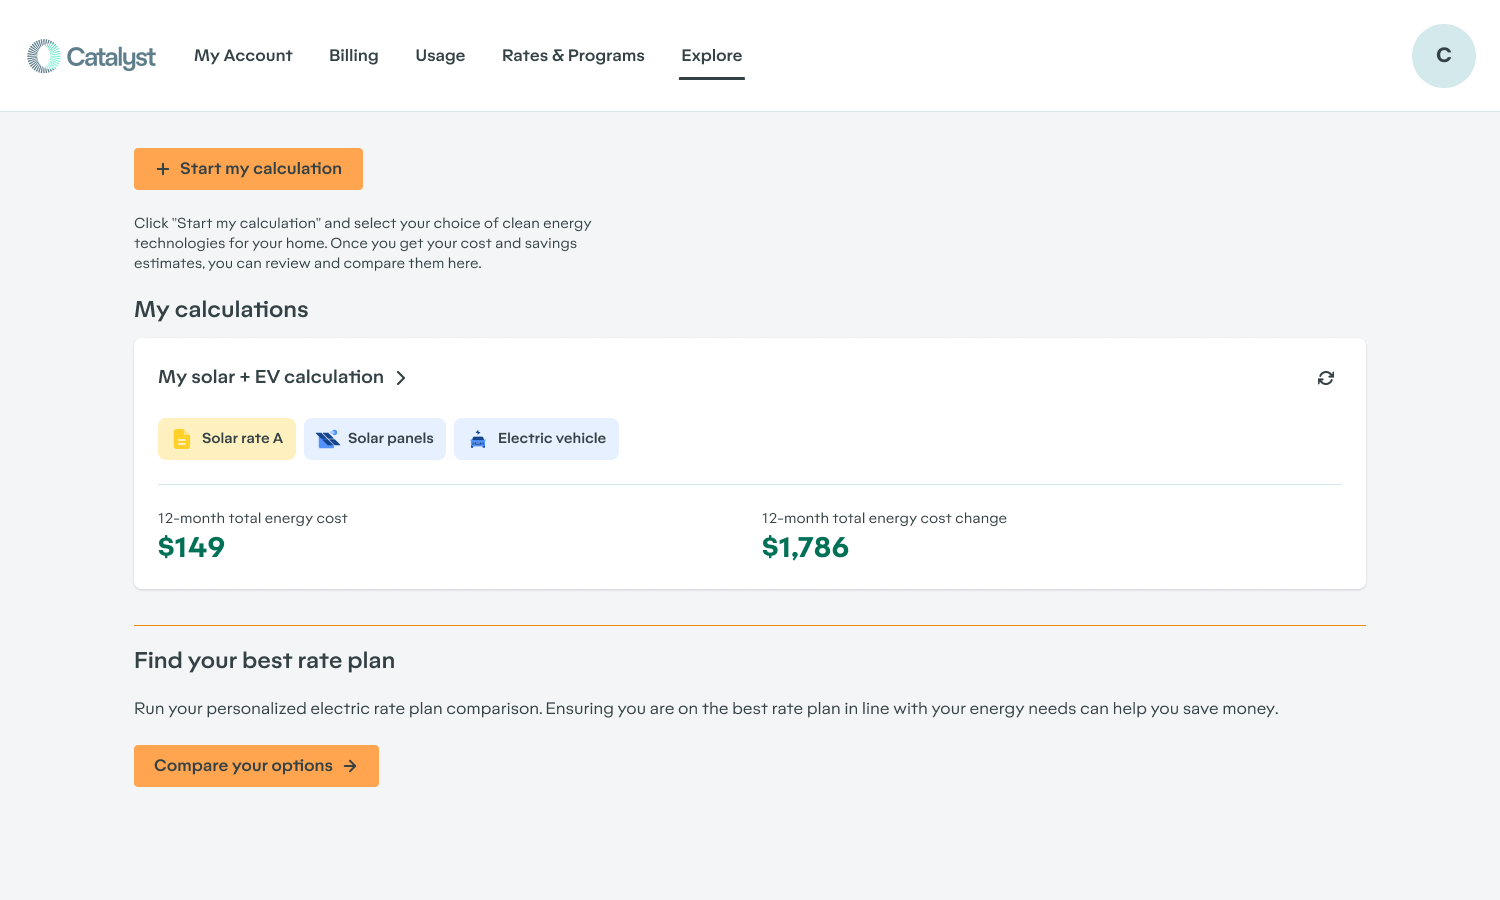
The calculations list shows all past calculations created by the user. Each calculation list item includes an overview of applied clean energy products and energy cost savings, allowing the user to compare scenarios at a glance. Users can create new calculations by clicking the primary “Start my calculation” button.
Configuration
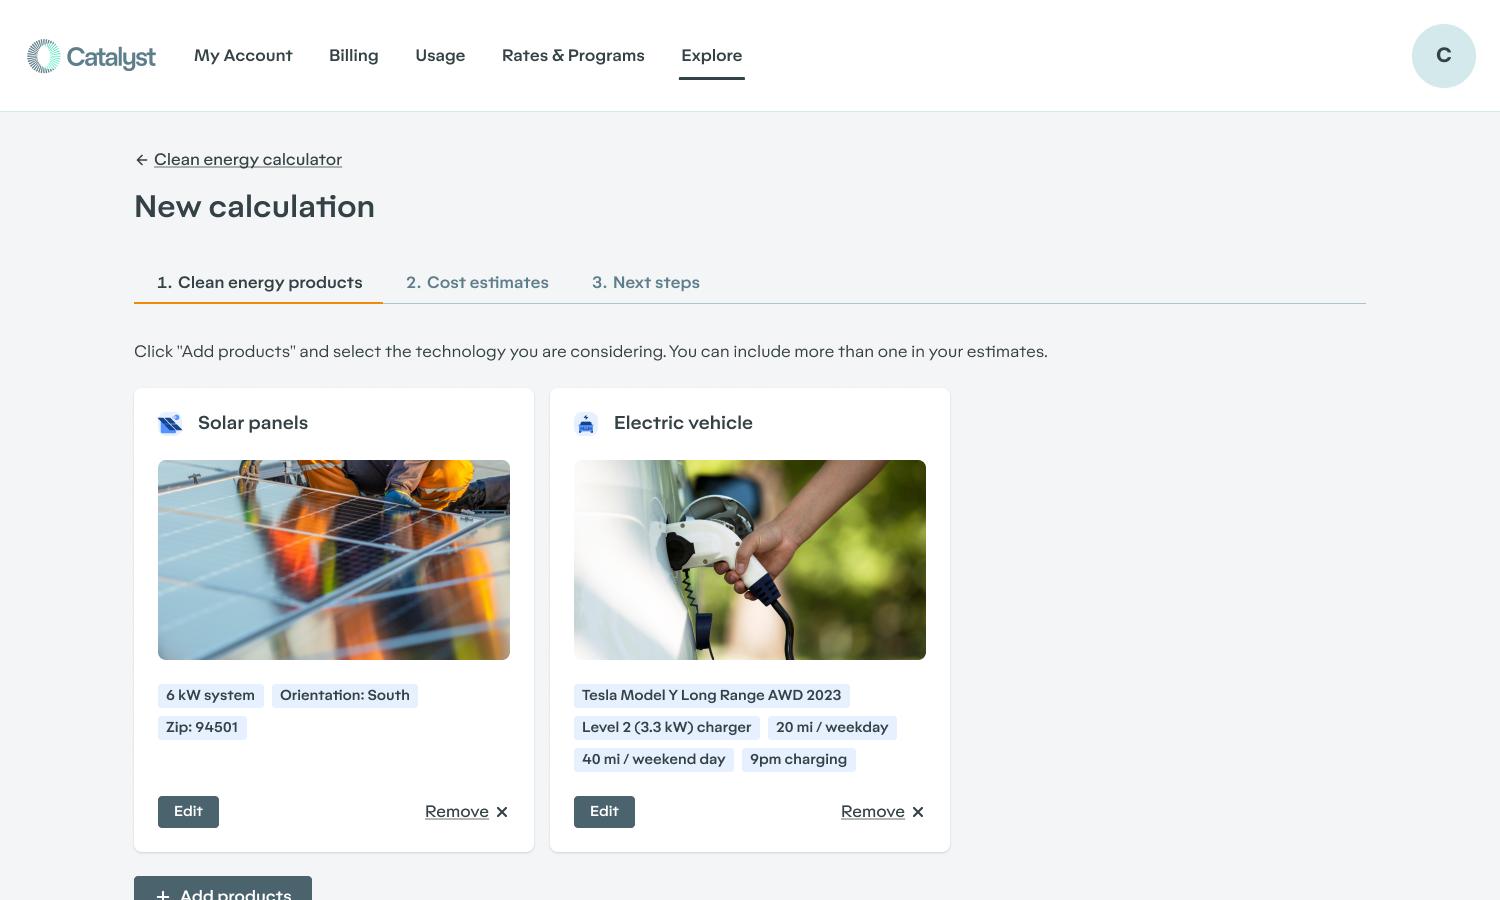
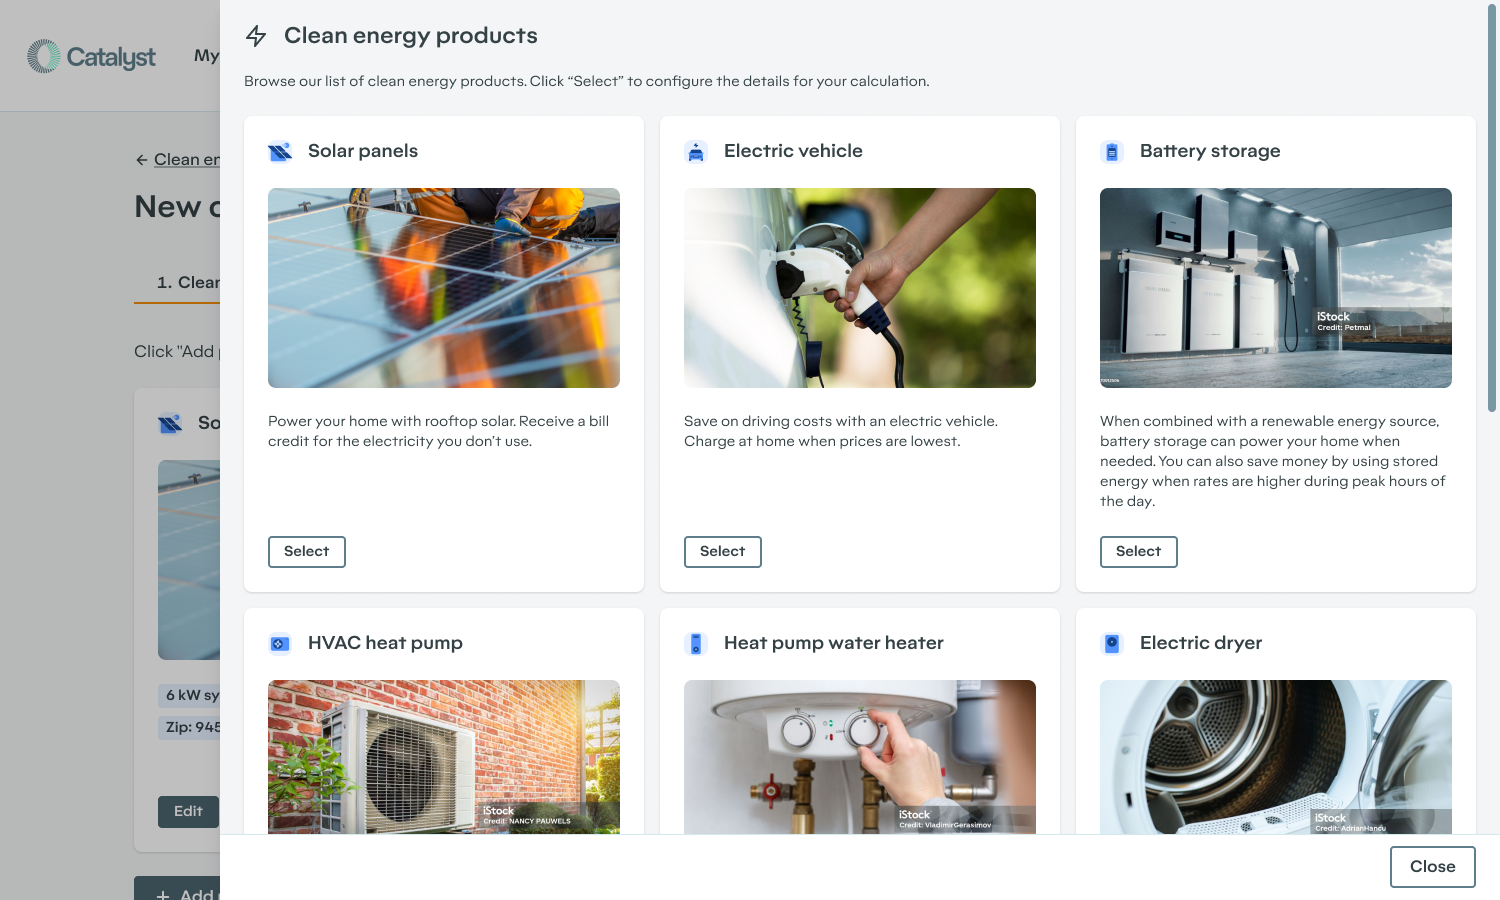
To configure a new calculation, users browse from a list of clean energy products, select, and adjust the parameters to their needs. The parameters for each product (based on Gridx modifier APIs) are designed to be simple and understandable for non-experts, and many fields can be automatically populated based on user data (e.g. location, solar system capacity). Users can select as many products as they like and the calculation will account for all of them. Available clean energy products include:
Solar panels
Electric vehicle
Battery storage
HVAC heat pump
Heat pump water heater
Electric dryer
Electric range
Once the user has selected and configured their clean energy products, they can click the primary “Cost estimates” button to run the calculation and proceed to the next step.
Results
Once complete, the calculation provides forward-looking billing and usage estimates. Usage estimates are based on the user's historical data (usually rolling past 12 months), modified by clean energy products. Billing estimates are based on the lowest cost rate, which is derived from the calculation with forward-looking prices (usually the rolling next 12 months). Completed calculations are automatically saved to the user’s “My calculations” list so they can return or compare at any time.
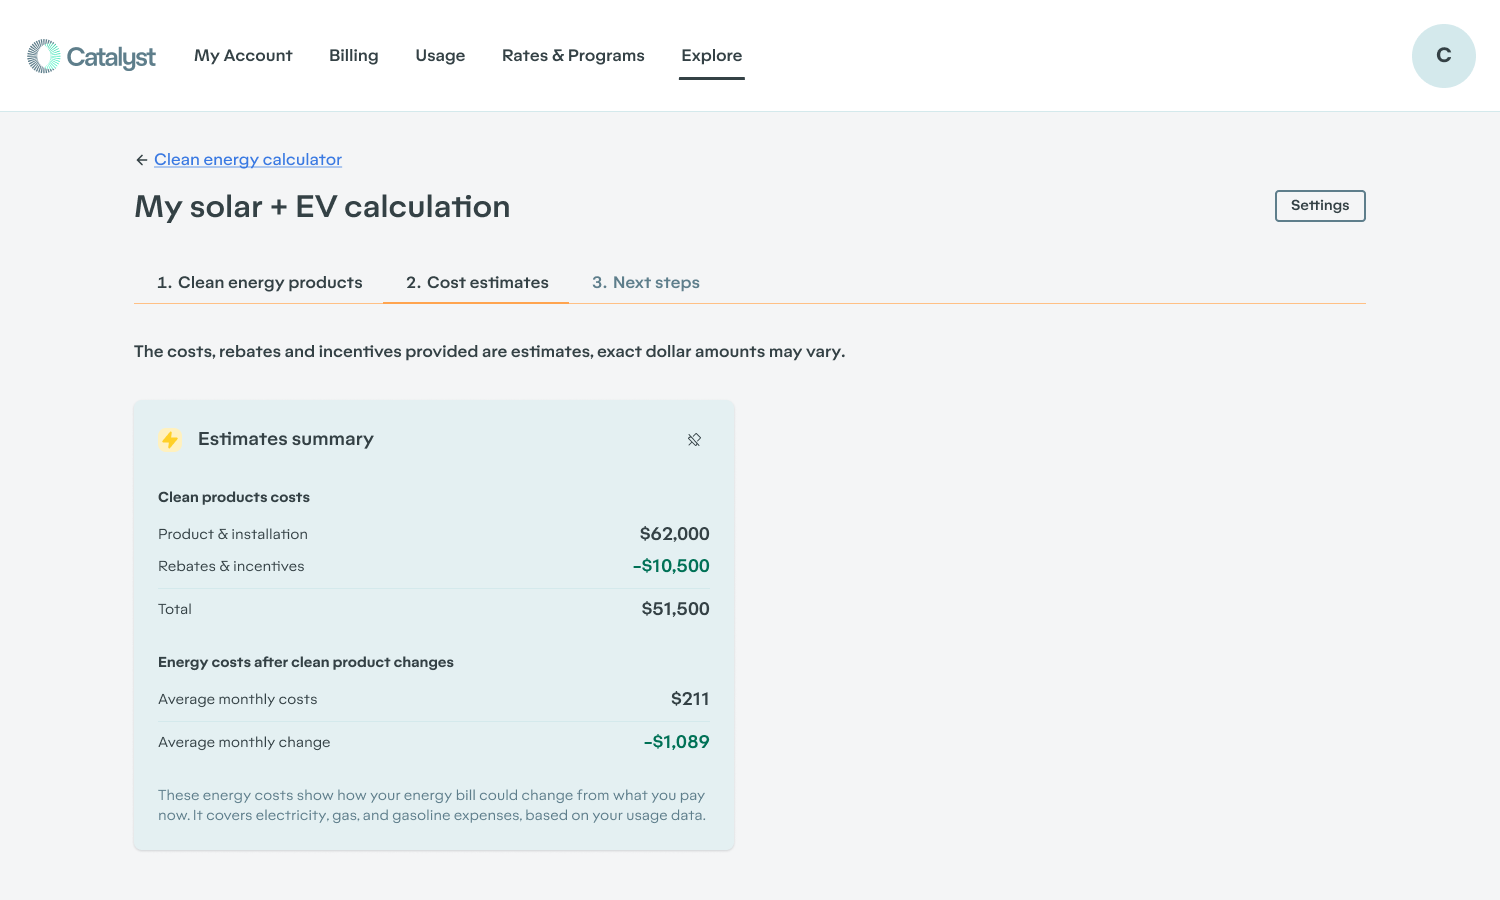
Estimates Summary
The calculation provides an estimates summary at the top of the page, allowing users to quickly assess the costs and benefits of the clean energy products they are considering. The summary provides the total fixed cost minus rebates and incentives for the selected products along with monthly energy costs and savings.
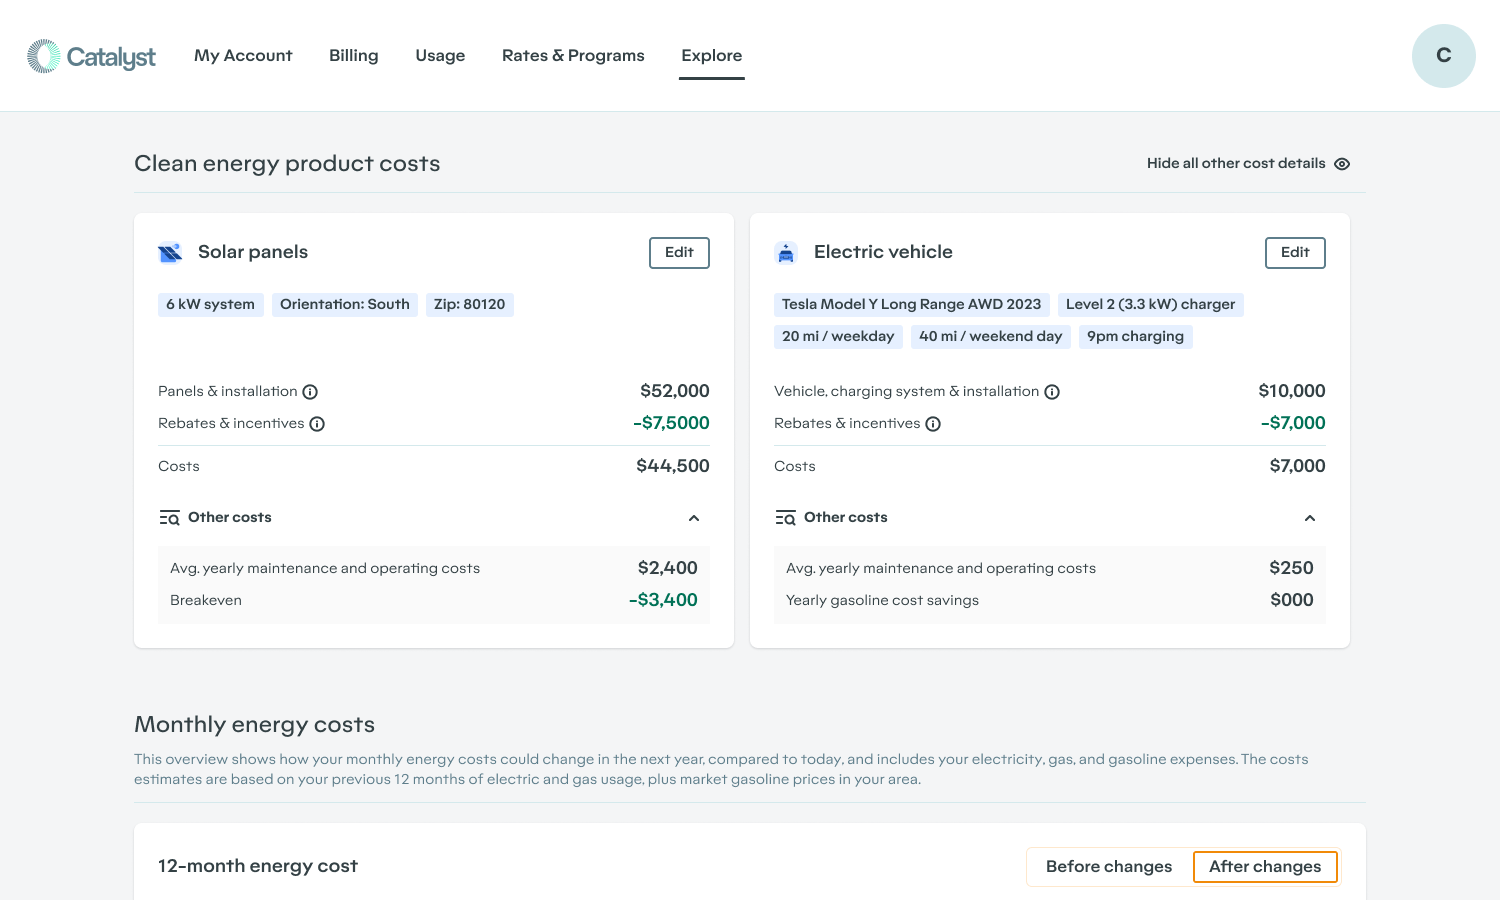
Fixed Costs & Incentives Estimates
The calculation accounts for up-front and fixed costs which vary by clean energy product but typically include purchase price, installation and maintenance. Estimates can also account for incentives like rebates and tax credits, which can be specified by the utility per product. Combined with monthly energy estimates, these fixed costs and incentive estimates provide users with a total cost of ownership and payback timeline for the given clean energy products.
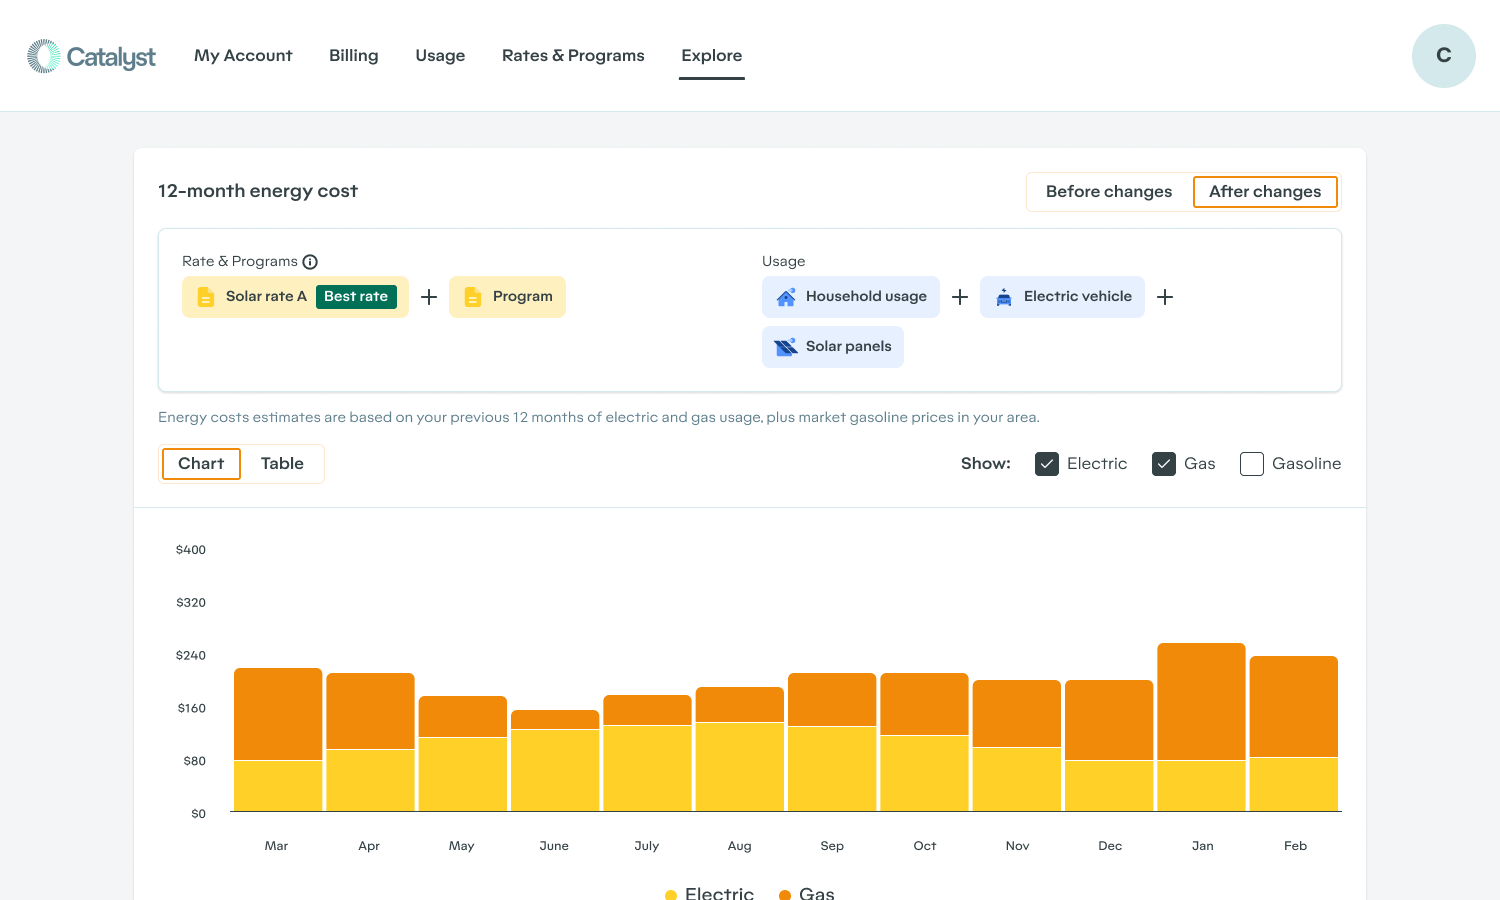
Monthly Energy Estimates
In addition to fixed costs, the calculation provides monthly estimates for both electric and gas billing and usage, allowing users to understand the impact of clean energy products on their entire energy bill. This is important for electrification products like electric vehicles or heat pumps which result in higher electric bills but lower combined energy costs.
Calculations involving an electric vehicle also include gasoline cost and usage estimates based on user mileage inputs and average market gasoline prices in a given area. This allows users to understand the cost of home charging vs. gasoline as a part or their monthly energy costs.
Energy estimates are provided at a monthly and yearly level and users can toggle electric, gas and gasoline in order to get a combined or isolated view. Users can also toggle between estimates before and after changes, allowing them to see how their bills will be impacted by clean energy products and rate changes vs. no changes at all.
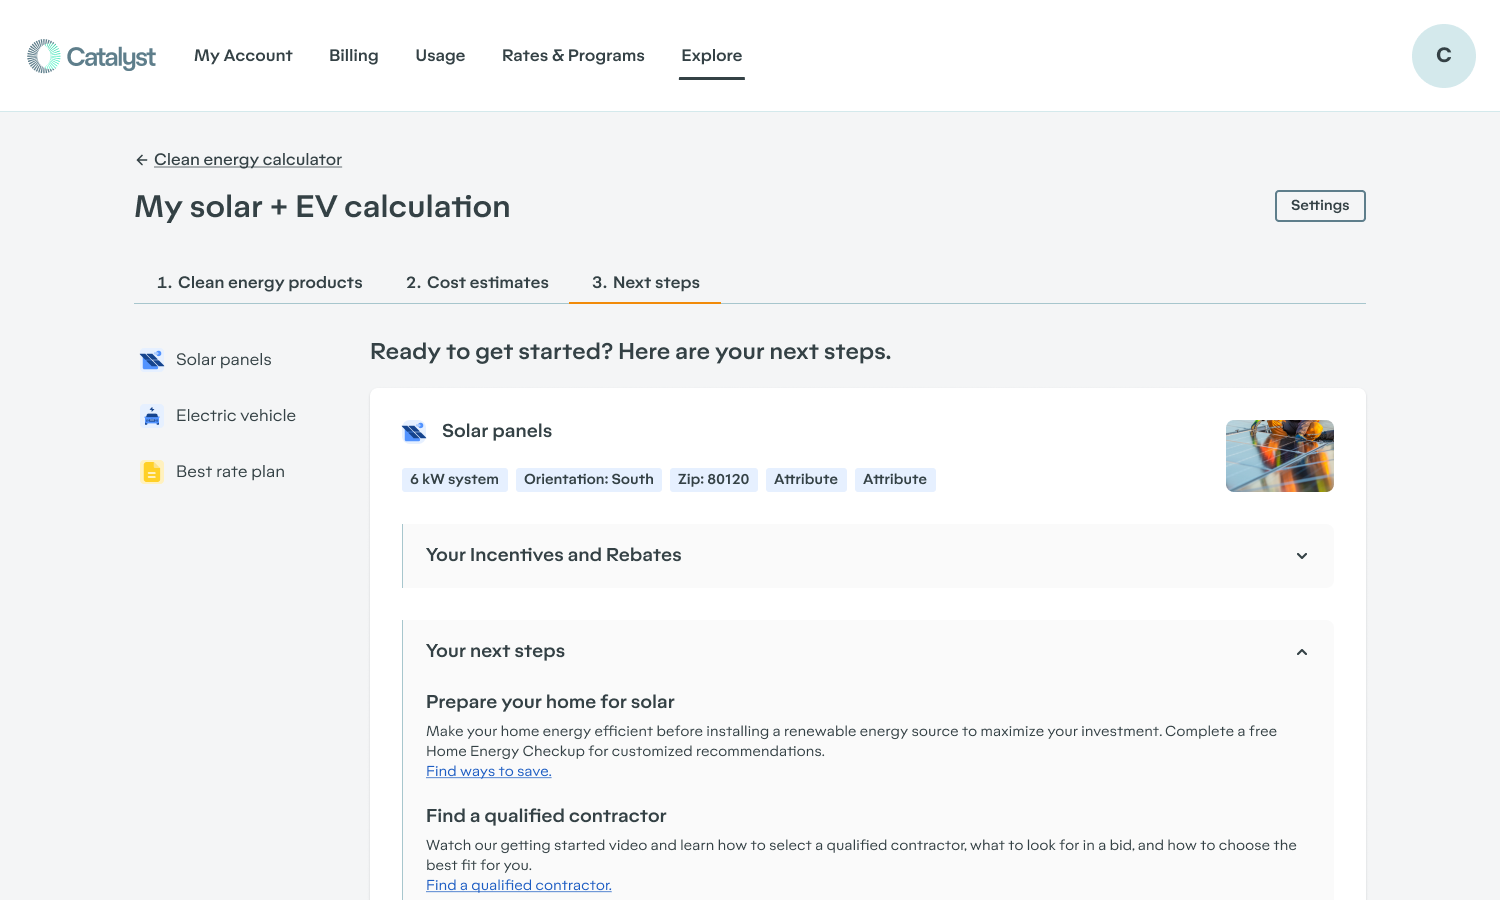
Implementation
Each calculation includes implementation tips based on the selected products and best rate. These typically cover next steps for acquiring and installing the selected products, as well as important information about the best rate and how to enroll. In addition to implementation tips, each section includes links to relevant incentives and rebates. Content can be configured per product and rate by the utility and can include multiple headings, paragraphs and links.
Once a user has calculated the cost and savings estimates of their clean energy choices, this page helps a them complete their journey by guiding them through the implementation and rate enrollment processes.
Accessibility & User Experience
GridX Explore is designed to be as simple as possible for non-experts and has been tested extensively to optimize ease-of-use. Users are guided through the calculation process in a 3-step wizard, with instructions and clear calls to action on each step. The experience is browser-based; all layouts and UI components are responsive and accessible on any device. GridX supports WCAG 2.2 accessibility standards and uses Google Lighthouse and Microsoft Accessibility to test page performance and accessibility.
Theming & Content Management
Utilities can theme GridX Explore according to their brand standards by providing a small number of style values. These values map to colors, fonts and borders throughout the UI, so that the entire experience looks native to the utility website. Utilities can also customize most copy throughout the experience like descriptions, helper text and button labels. Some functional copy is not editable, such as input labels. Images can also be updated by the utility, including the landing page image and modifier images. Some functional icons are not editable.
AMI Data Requirements
The most granular interval usage data (e.g. 15min) is required for accurate calculations. All billing-relevant interval channels are required including “kWh delivered” and “kWh received”. All interval data should be “post VEE” to ensure all calculations align with billed totals. Meter registers (or billing determinants) are often required if that is the source of truth for consumption values. These quantities also have the added value of supporting our interval data validation process that ensures the interval data aligns with billed quantities.
Generally, 12 months of historical interval data is required to support analyses though certain tariffs (i.e. Net Metering, Demand Ratchets) require additional history to properly calculate one year’s worth of bills. There is no technical requirement for interval data history but an important business requirement to consider.
Daily refresh of the data is sufficient for most use cases; however, the requirements for usage charts are trending towards support for near real-time ingestion and display.