
Empower
Overview
GridX Empower  is a set of rate and bill analysis APIs, batch reports, and web components that deliver personalized and insightful content to customers so they can make the right clean energy decisions. Utilities and technology companies use these APIs and embeddable web components to show energy customers the bill impact of all eligible rates, programs and distributed energy resources.
APIs
Empower APIs cover a variety of use cases including rate analysis, bill to-date, bill analysis and forecast, customer management, and analysis modifiers. See the developer API documentation for more detailed information.
getSummary API
The getSummary API provides rate analysis results summarized across an analysis period, typically 12 months. The API results are pre-calculated and return the base scenario costs and all target scenario costs based on utility eligibility requirements. A scenario is defined as a combination of a rate, zero or multiple riders/options, and actual or modified consumption data.
This API summarizes the eligible rates and potential yearly savings for customers provided consumption patterns do not significantly change. See developer documentation for more detailed information on the getSummary API.
compareResult API
The compareResult API provides the monthly rate analysis results. The API results are pre-calculated and return the base scenario costs and all target scenario costs based on utility eligibility requirements. A scenario is defined as a combination of a rate, zero or multiple riders/options, and actual or modified consumption data.
In addition to cost information, the API returns the line item details, usage breakdown, and all attributes and options per scenario per bill month. See developer documentation for more detailed information on the compareResult API.
compareCalculate API
The compareCalculate API supports real time what-if analysis to help customers evaluate how DERs (e.g. solar, EV, batteries), electrification technologies (e.g. heat pump, electric dryer) and behavior changes (e.g. load shift) impact their bills and which rate/programs lead to the most savings.
compareCalculate returns the customer’s monthly bill amount and details for the what-if scenarios as determined by the utility's eligibility requirements. See developer documentation for more detailed information on the compareCalculate API.
iCost API
The iCost API calculates energy costs on a per-interval basis, using the customer’s rate and historical consumption to communicate how their energy use over the course of a day, week or month impacts their bill.
This API can be used for a variety of purposes such as:
Cost over time charts to communicate what time of day is most expensive
Visualizing customer usage profiles and how they align with time-of-use periods
Informing customers how (TOU) prices change over the course of a day
See developer documentation for more detailed information on the iCost API.
billForecast API
The billForecast API provides customers with their costs incurred to-date ("bill-to-date") and what they should expect to pay on their next bill using the latest available usage and rates data. This service can also support related features such as high bill alerts. See developer documentation for more detailed information on the billForecast API.
billCompare API
The billCompare API informs users of how and why their bills fluctuate over time. It allows for direct comparison between any bills for the same customer. The intent is to help educate users on how and why bills change by providing differences between bills and how outside factors impact these variances.
The billCompare API leverages a variety of algorithms to determine the reason for the bill difference and classify based on the following categories. This section is found under the categoryDetails section in the API response. It has a variety of categories and sub-categories that should all add up to the total difference between bills. See developer documentation for more detailed information on the billCompare API.
Usage API
The Usage API provides usage data for one or many usage points (meteraccount). It returns meter associations as well as usage data per meter. It can be used to support interval usage charts and usage exports such as Green Button. See developer documentation for more detailed information on the Usage API.
customerProfile API
The customerProfile API provides the current and historical data for the requested customer. This includes the customer’s contract details, attributes, bill summaries and rate history.
The endpoint is updated frequently with current and historical information relating to the following:
Account Associations and Contract History
Billing Cycles
Attributes
Rate Codes
See developer documentation for more detailed information on the customerProfile API.
Modifier APIs
Modifier APIs allow utilities and partners to support critical "what-if" questions regarding their bills. Modifiers are applied to the customer's historical interval to simulate a vast range of scenarios representing customer behavior changes and technology adoption. Available modifiers include:
Load Adjustment
Load Shift
Attribute Modifier
Electric Vehicle
Soloar Modifier
Channel Modifier
Heat Pump Climate Control
See developer documentation for more detailed information on modifiers.
Batch Reports
GridX Empower Batch Insights supports full population rate analysis reporting to drive marketing, education and outreach campaigns. Batch Insights is an automated flat file report with detailed rate, cost and usage metrics such as TOU consumption and charges. These automated reports can be integrated with the utility’s preferred vendor for outbound communication (i.e. email, paper mail).
Widgets
GridX Empower widgets are embeddable web components that efficiently deliver API insights to the user experience. Widget messaging, styling and functionality are stored in a single JavaScript file for each component and easily themed to specific brand guidelines and language. GridX's web components use JWT tokens provided by the client's web service to authenticate the customer and retrieve the unique identifier for the customer (GridX contract id).
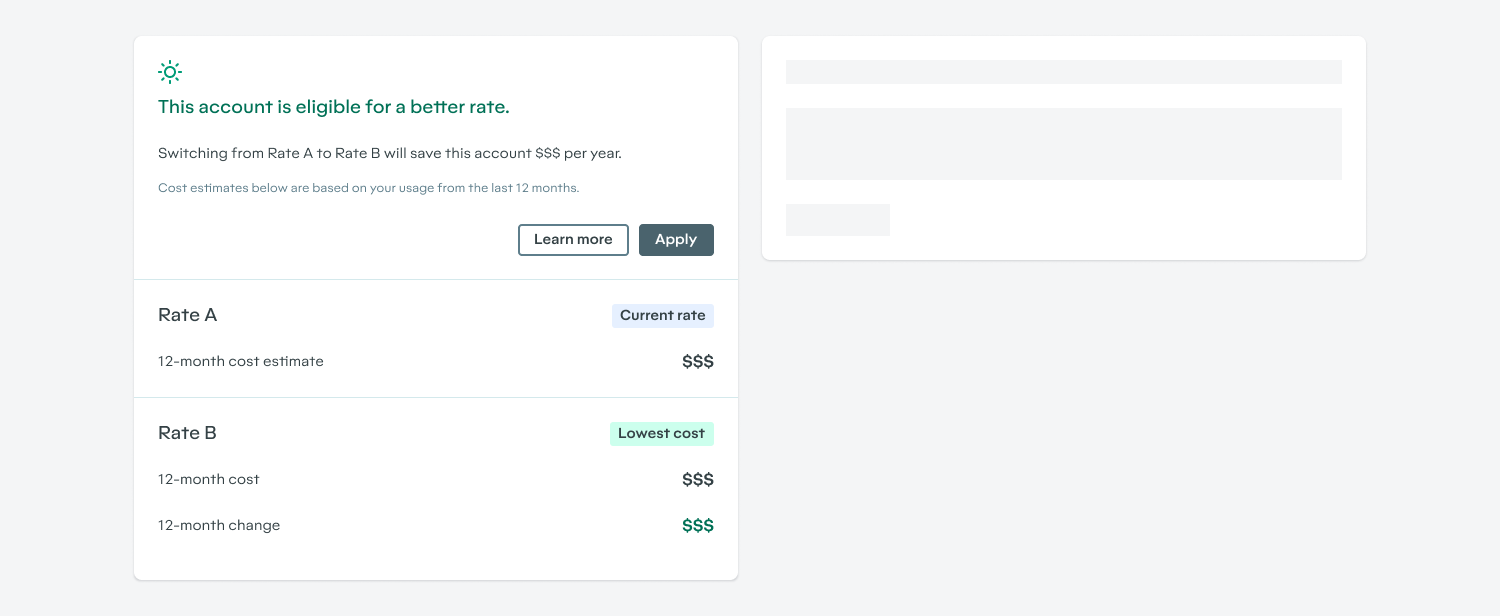
Summary Rate Comparison Widget
The Summary Rate Comparison Widget visualizes rate analysis results summarized across an analysis period, typically 12 months. The widget visualizes the personalized cost comparison for a customer under one or more energy use scenarios. Each scenario is a combination of the rate the customer is currently on, rates the customer is otherwise eligible for, zero or more options/riders, and the customer’s actual historical consumption. The Summary Rate Comparison Widget is built on the getSummary API.
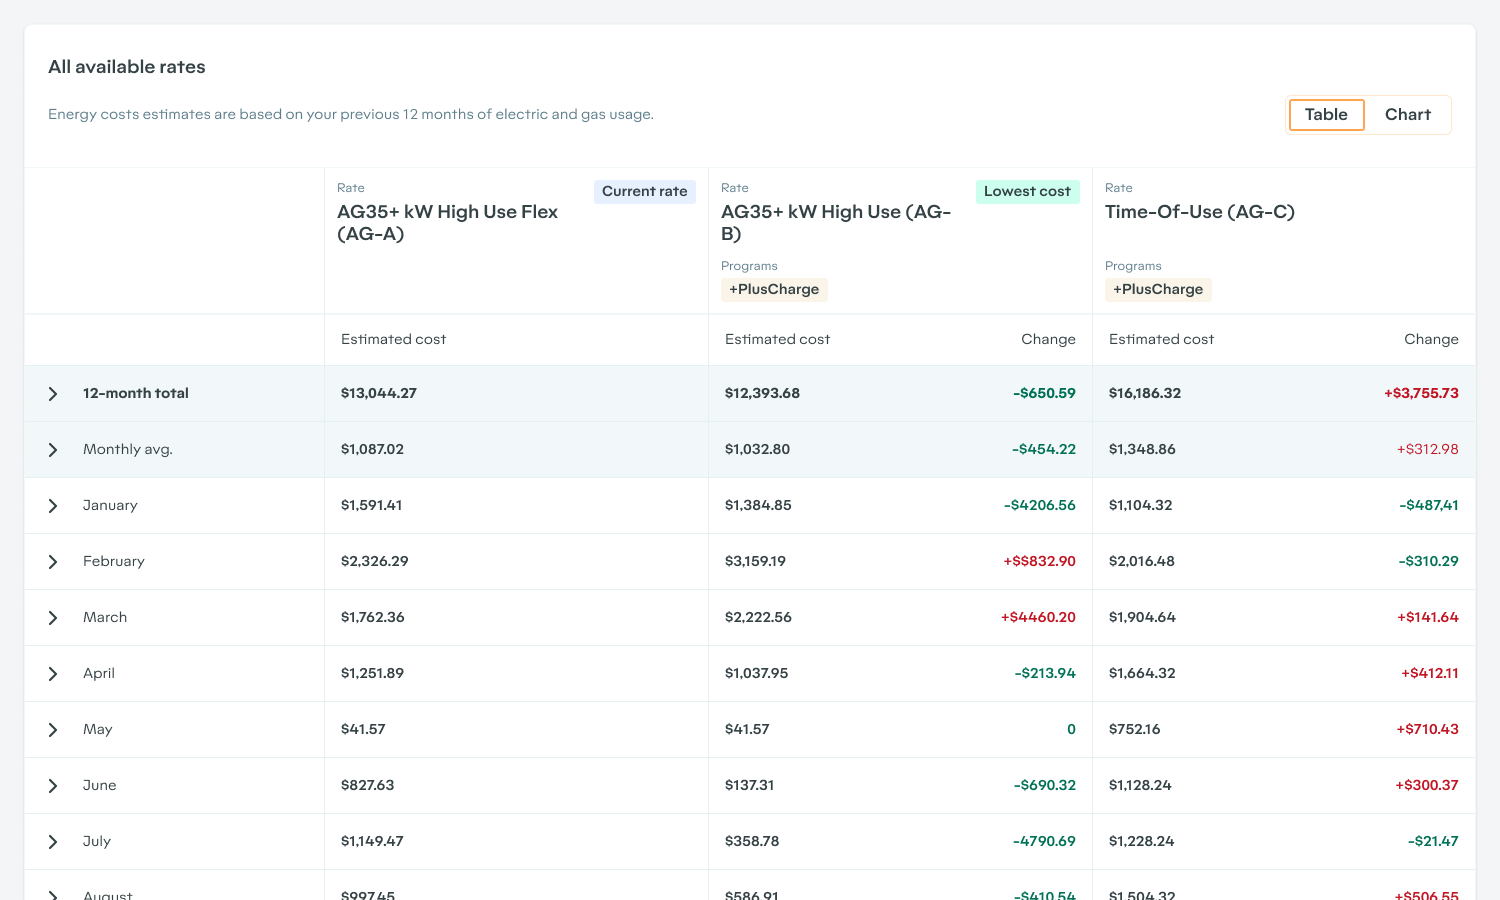
Detailed Rate Comparison Widget
The Detailed Rate Comparison Widget visualizes rate analysis results at the bill cycle level including all bill line items and usage metrics (e.g. peak consumption). The widget contains the personalized cost comparison for a customer under one or more energy use scenarios. Each scenario is a combination of the rate the customer is currently on, rates the customer is otherwise eligible for, zero or more options/riders, and the customer’s actual historical consumption. The Detailed Rate Comparison Widget is built on the compareResult API.
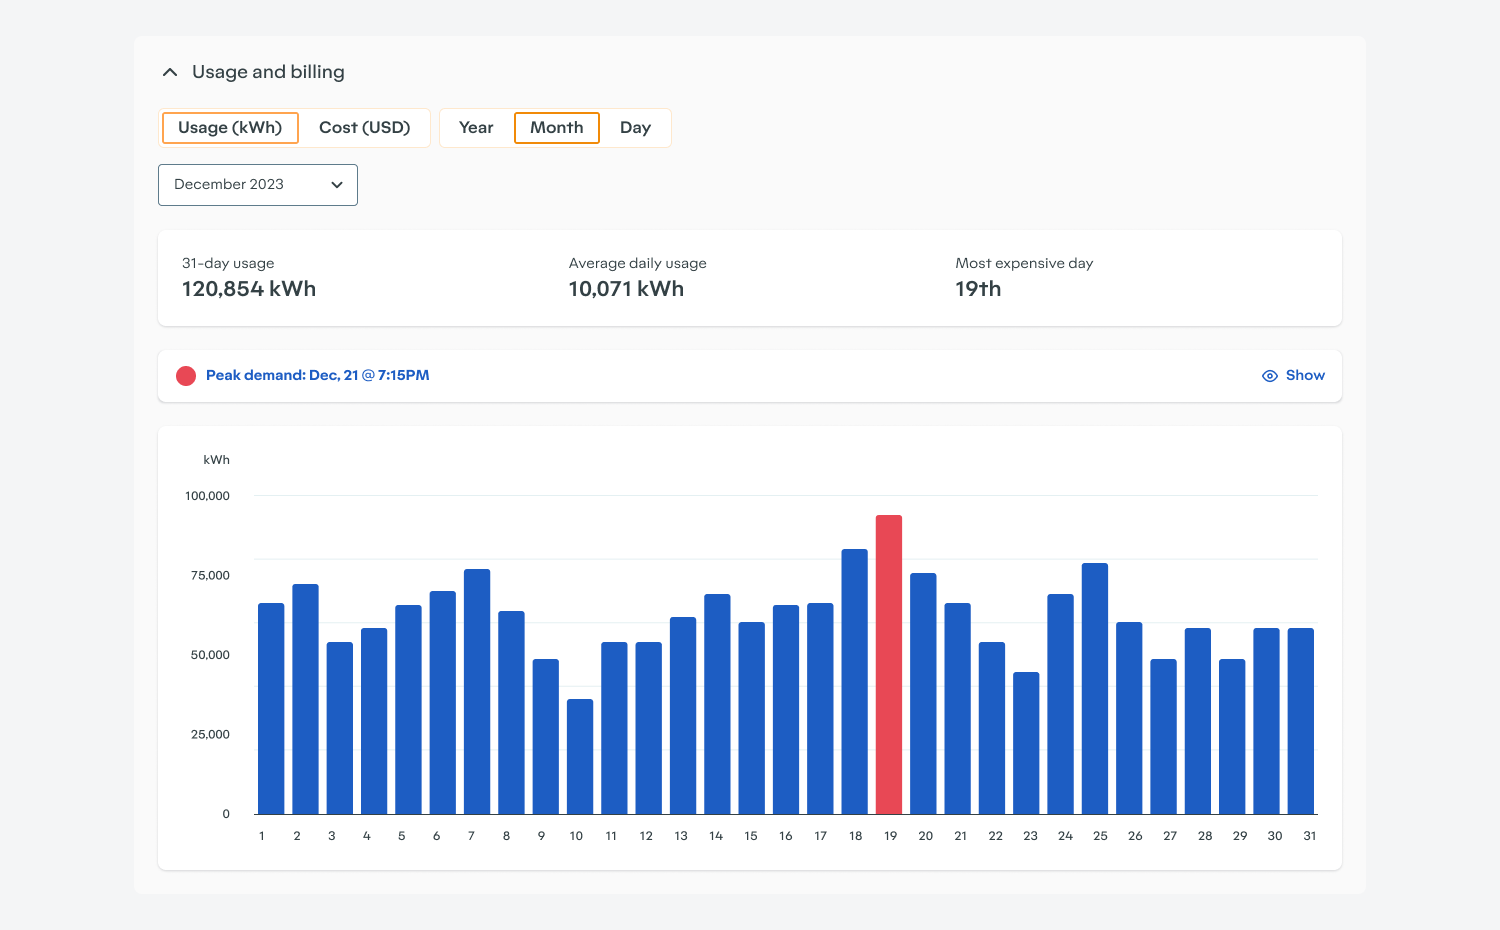
Usage, Cost and Pricing Widget
The Usage, Cost and Pricing Widget visualizes usage, cost and prices across various time horizons including interval (5min, 15min, hourly), daily and monthly. The intent is to inform customers how their usage patterns affect their bills while providing helpful context to inform better energy usage decisions.
The Usage, Cost and Pricing Widget is built on the iCost API.
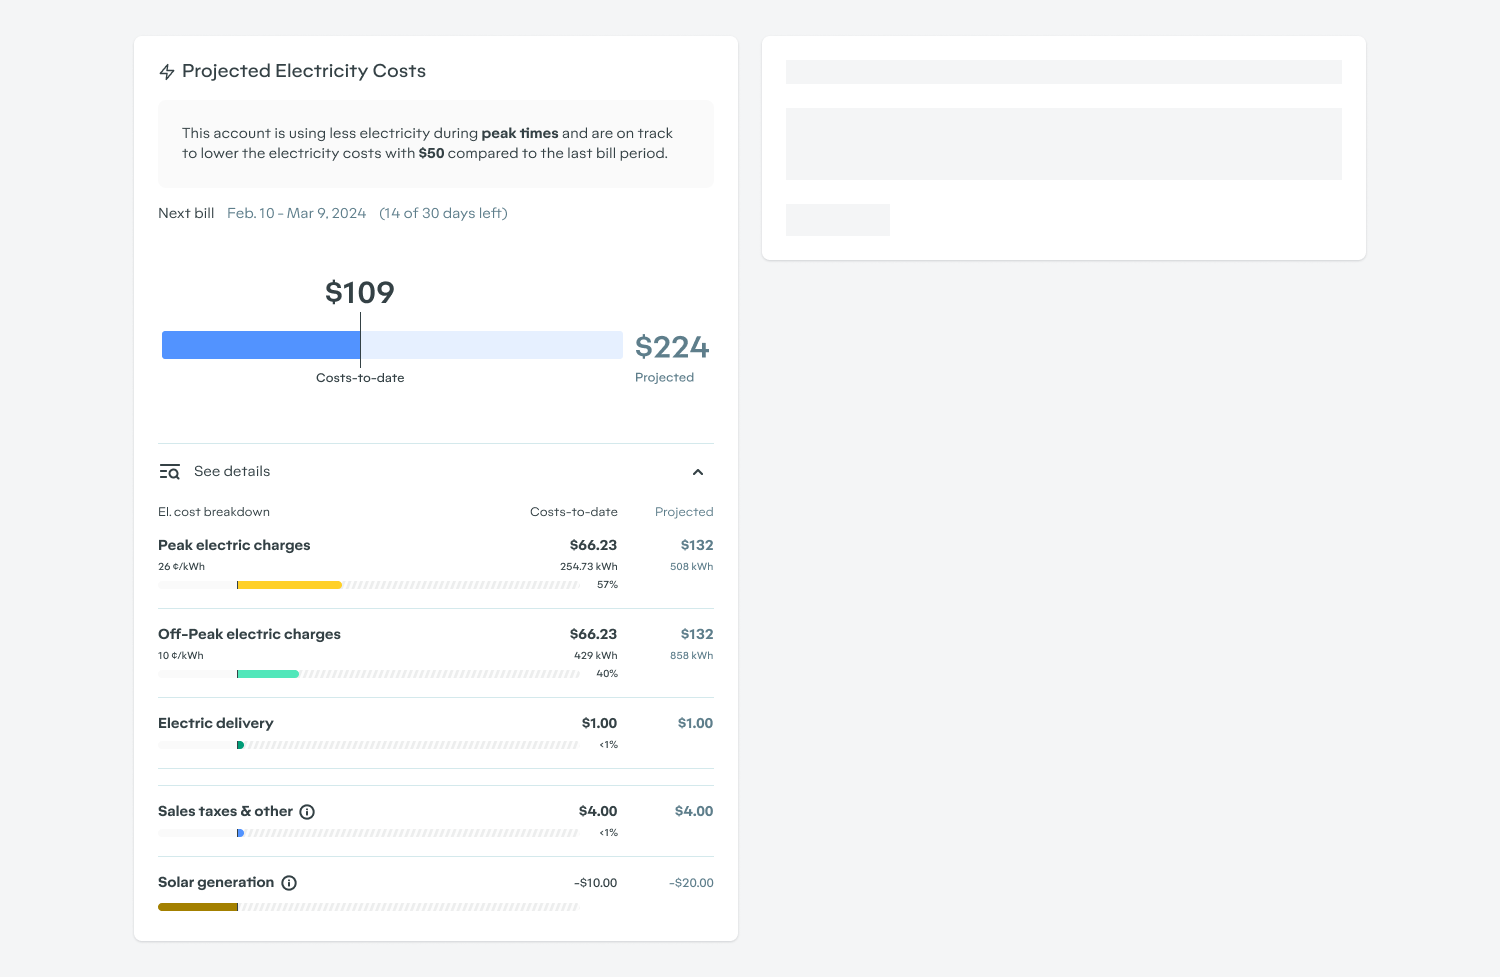
Bill Forecast Widget
The Bill Forecast Widget visualizes the projected bill amount for the current bill cycle, including costs incurred to-date. The projected bill calculation leverages a usage forecast through the end of the bill cycle while the bill to-date bill calculation provides the bill amount as if the bill cycle ended today. Each calculation represents the full bill amount including all applicable line items to drive further insights around cost and usage for the current bill cycle.
The Bill Forecast is built on the billForecast API.
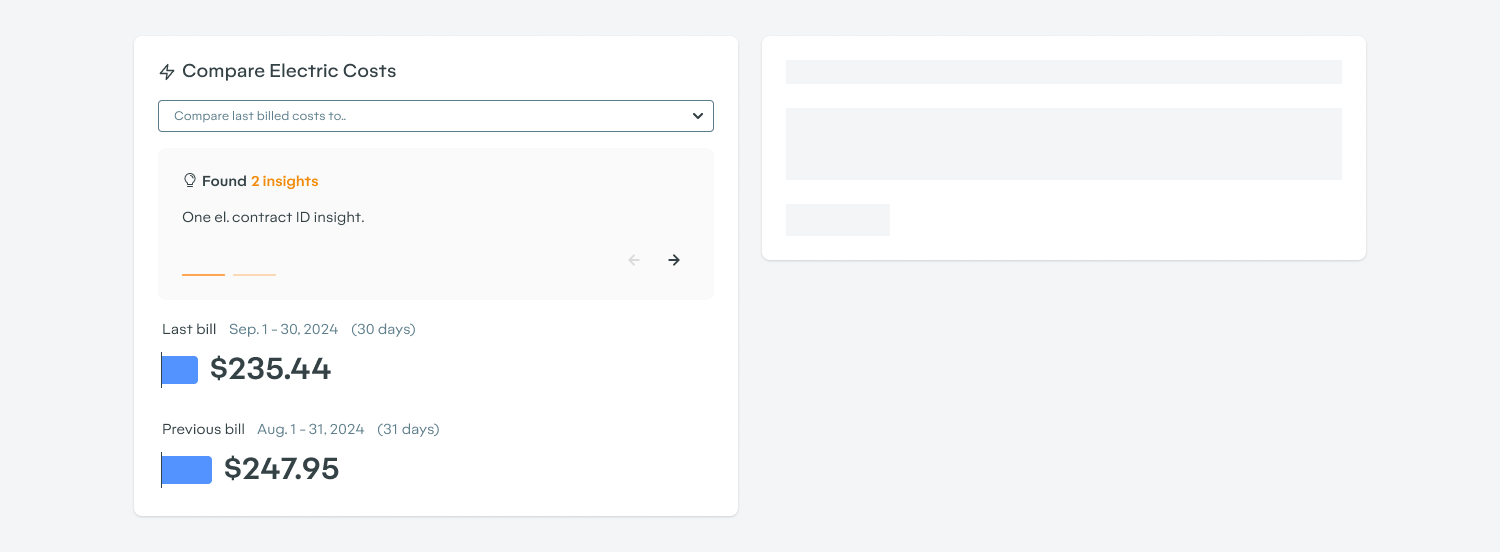
Bill Comparison Widget
The Bill Comparison Widget visualizes the recent bill history and allows the customer to compare any 2 bills to understand why their bills fluctuate month-to-month including customer behavior changes, utility price changes and weather.
The Bill Forecast is built on the billCompare API.
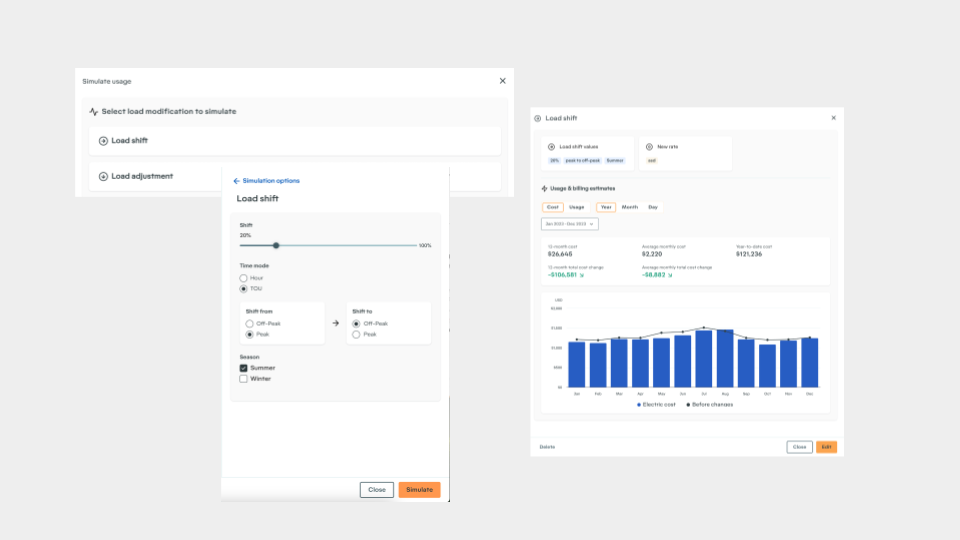
Modifier Widgets
The Modifiers allow customers to run "what-if" questions regarding their bills. Modifiers are applied to the customer's historical interval usage data to simulate a range of scenarios representing customer behavior changes and technology adoption. Currently, the supported Modifer widgets are:
Load Adjustment/Shift
Load Shed
The Modifier widgets are built on the compareCalculate API.
Accessibility & User Experience
GridX Empower widgets are designed to be as simple as possible for non-experts and have been tested to optimize ease-of-use. The experience is browser-based; all layouts and UI components are responsive and accessible on any device. GridX supports WCAG 2.2 accessibility standards and uses Google Lighthouse and Microsoft Accessibility to test page performance and accessibility.
Theming & Content Management
Utilities can theme GridX Empower widgets according to their brand standards by providing a small number of style values. These values map to colors, fonts & borders throughout the UI, so that the entire experience looks native to the utility website. Utilities can also customize most copy like descriptions, helper text & button labels.
AMI Data Requirements
The most granular interval usage data (e.g. 15min) is required for accurate calculations. All billing-relevant interval channels are required including “kWh delivered” and “kWh received”. All interval data should be “post VEE” to ensure all calculations align with billed totals. Meter registers (or billing determinants) are often required if that is the source of truth for consumption values. These quantities also have the added value of supporting our interval data validation process that ensures the interval data aligns with billed quantities.
Generally, 12 months of historical interval data is required to support analyses though certain tariffs (i.e. Net Metering, Demand Ratchets) require additional history to properly calculate one year’s worth of bills. There is no technical requirement for interval data history but an important business requirement to consider.
Daily refresh of the data is sufficient for most use cases; however, the requirements for usage charts are trending towards support for near real-time ingestion and display.
API SLA’s
Standard Uptime SLA
Category | Standard Uptime SLA | Max Downtime Per Month | Average Response Time (for 99% of the calls) | Average Number of Concurrent Calls |
|---|---|---|---|---|
Batch API | 99.5% | 3 hour 39 min | 6 seconds | 200 concurrent users |
Realtime API | 99.5% | 3 hour 39 min | 10 seconds | 10 concurrent users |
Billing API | 99.5% | 3 hour 39 min | 6 seconds | 200 concurrent users |
Premium Uptime SLA
Category | Premium Uptime SLA | Max Downtime Per Month | Average Response Time (for 99% of the calls) | Average Number of Concurrent Calls | |
|---|---|---|---|---|---|
Batch API | 99.9% | 43.8 min | 3 seconds | 200 concurrent users | |
Realtime API | 99.9% | 43.8 min | 6 seconds | 10 concurrent users | Pricing for the Real-time what-if APIs assumes the following SLAs: For 10 simultaneous users with 4 comparison scenarios, results will be returned within 6 seconds. For calculations that cannot be calculated in parallel (including some versions of Net Energy Metering), GridX cannot guarantee the return time for those results. A |
Billing API | 99.9% | 43.8 min | 3 seconds | 200 concurrent users |