
Create a portfolio analysis
Perform collection level analysis on all accounts within the portfolio.
Configuration
Configure rates, programs, modifiers and analysis settings.
Create on-demand what-if analyses at the portfolio level
Configure what-if scenarios:
Manually select rates or automatically identify the lowest cost rate
Configure analysis period which time bounds the analysis start and end date
Choose an effective price date to leverage current or historical rate pricing
Select calendar vs bill cycle reporting to show results by calendar months or align with your billing periods
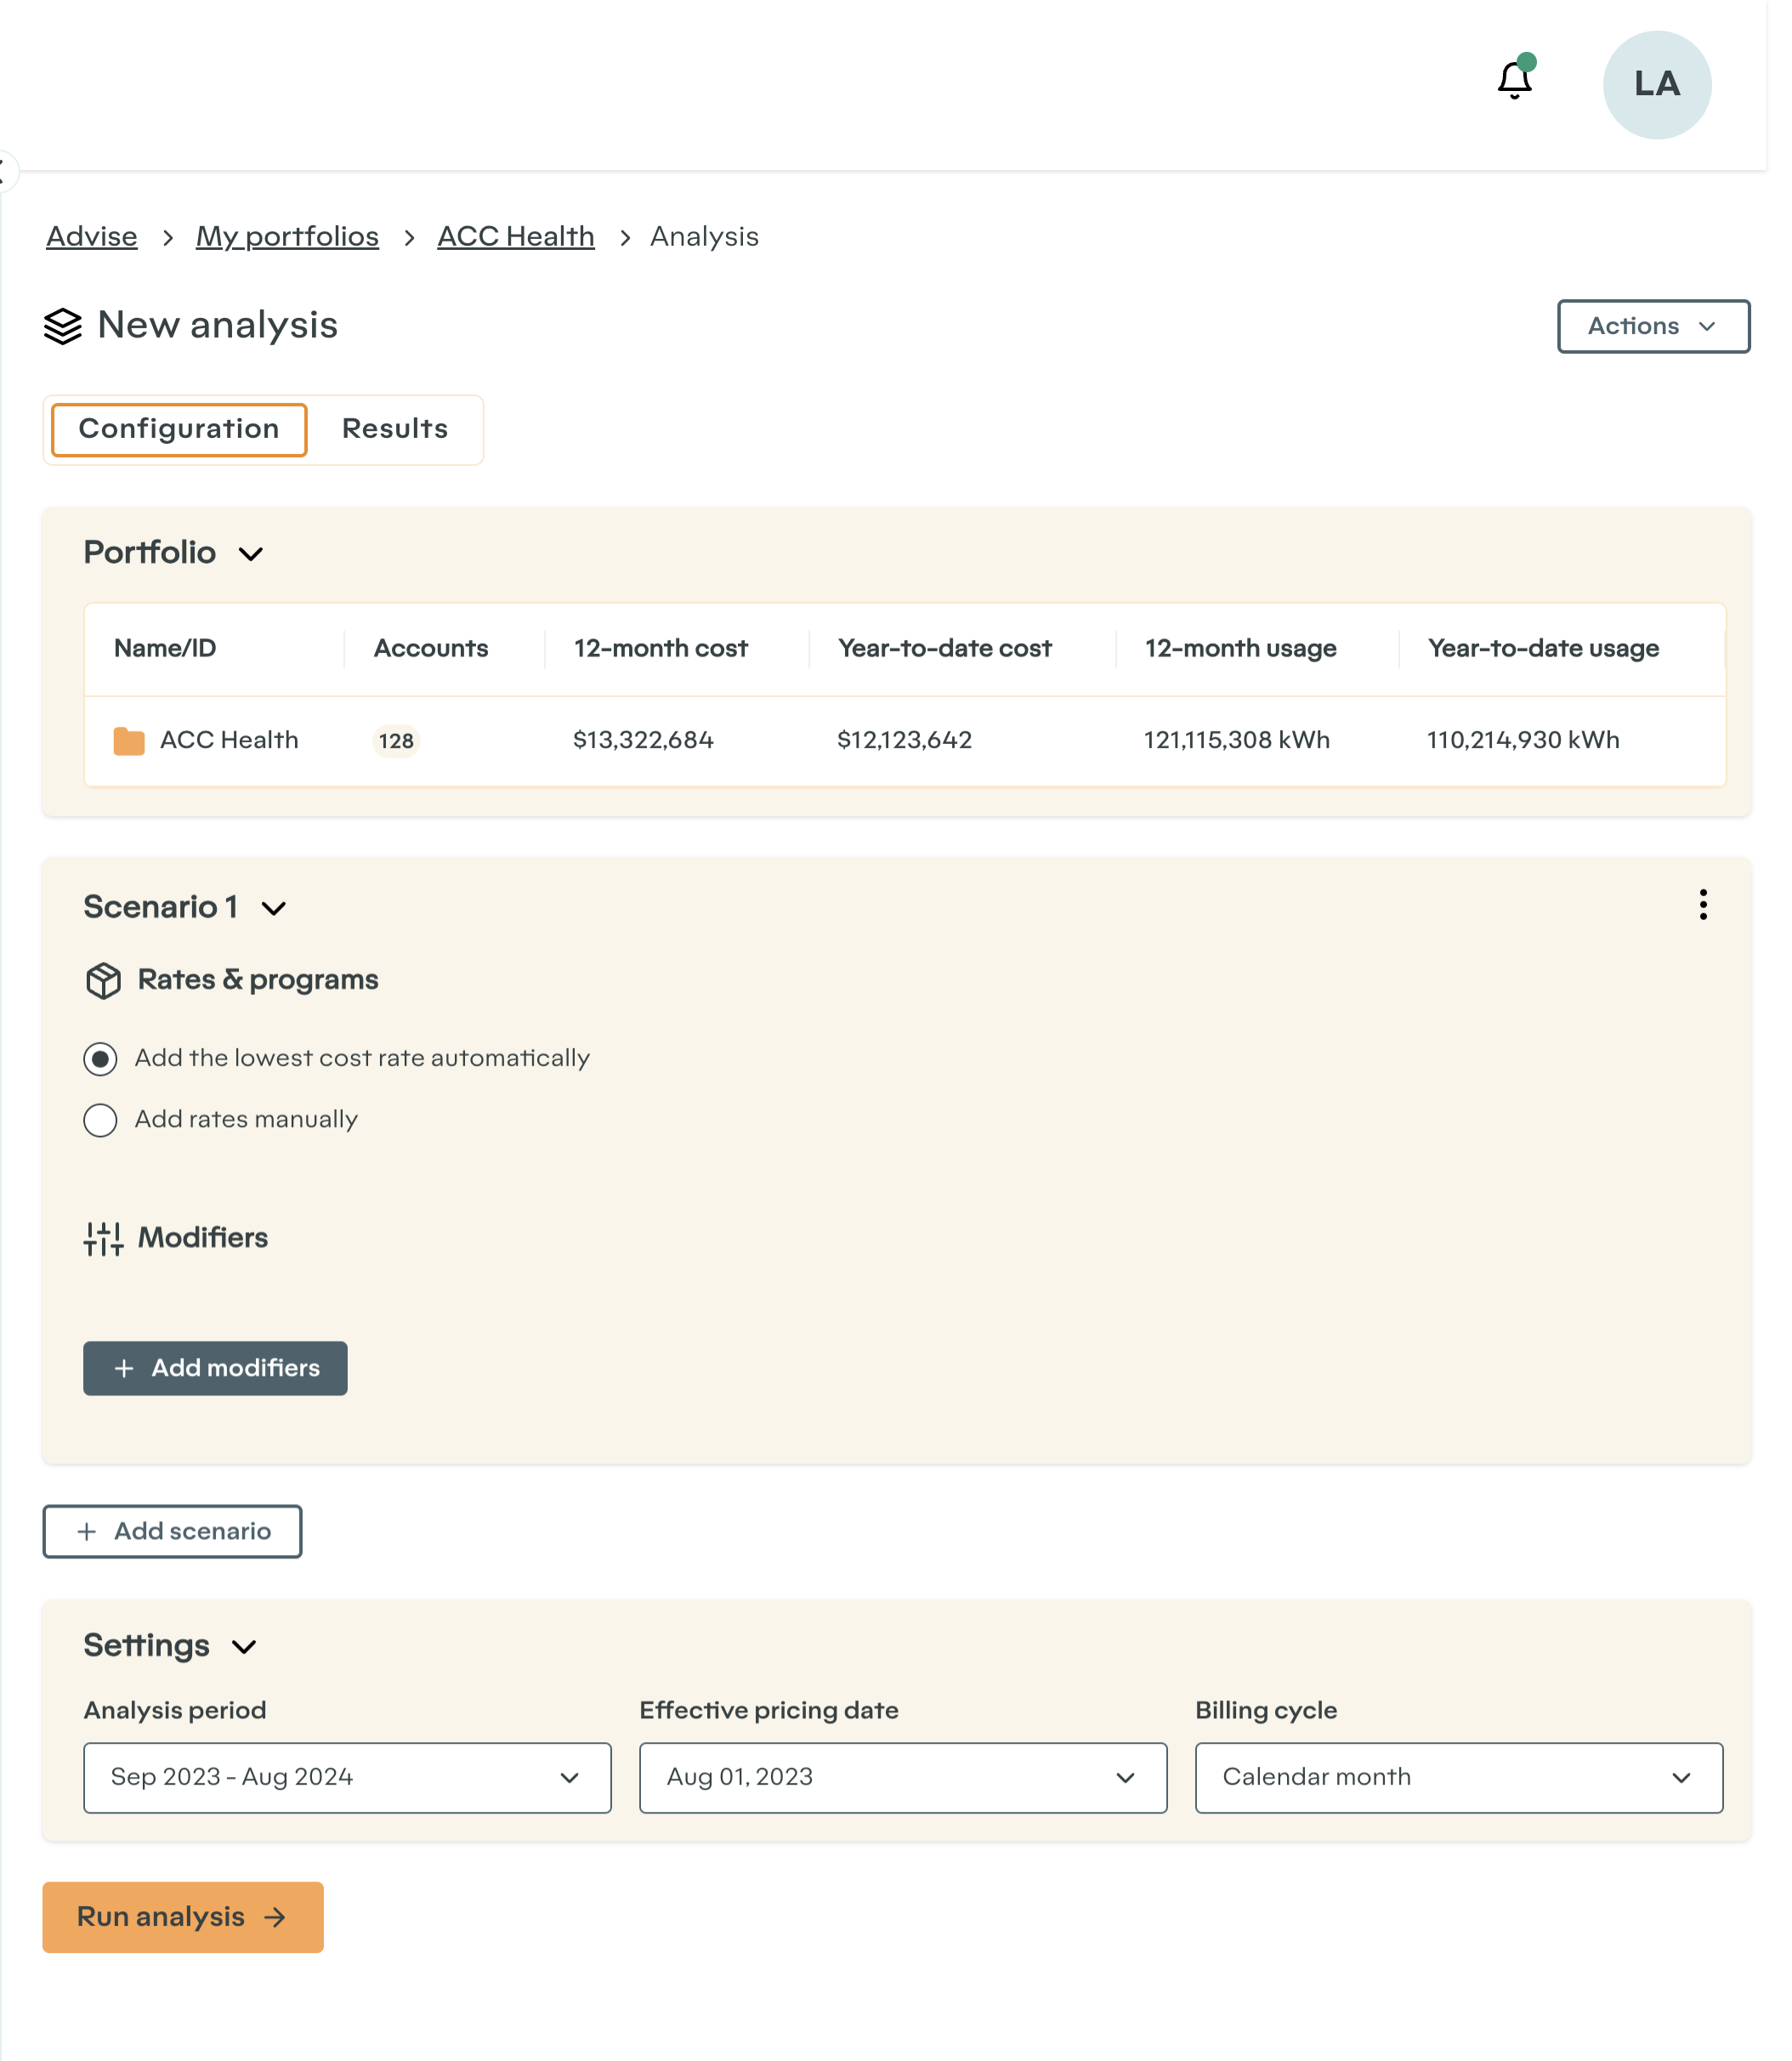
Portfolio analysis configuration controls.
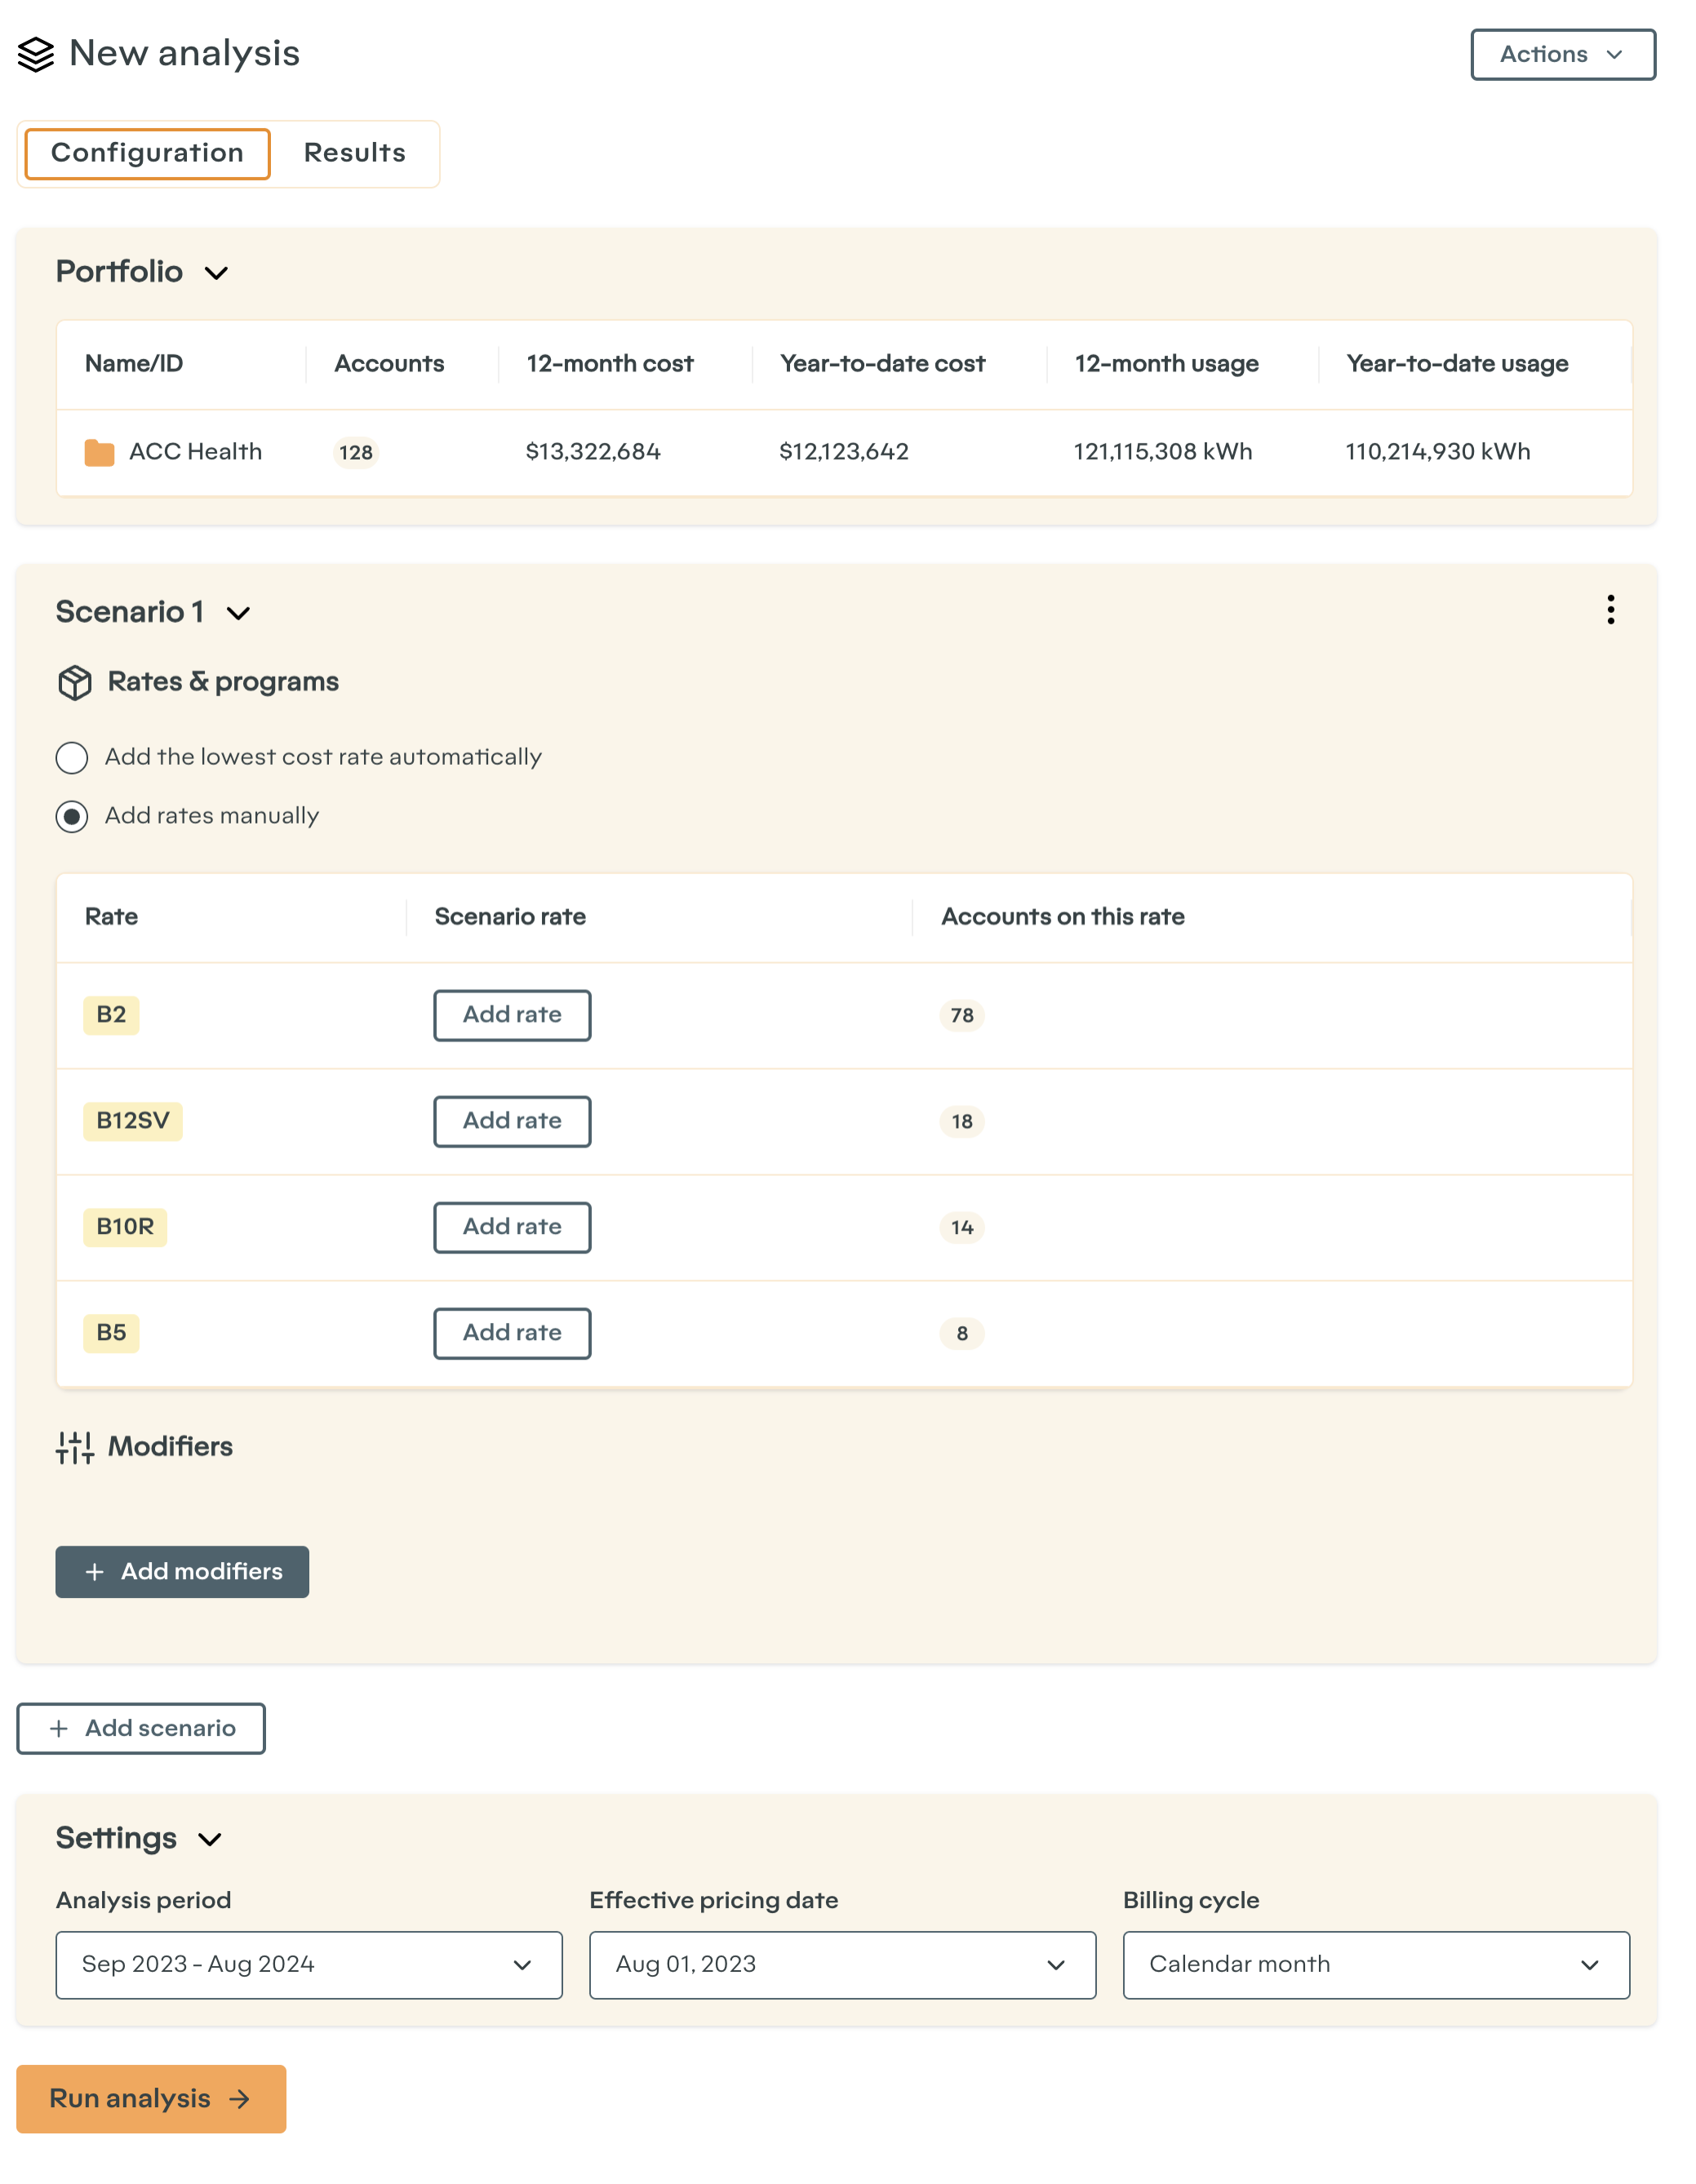
Portfolio analysis configuration controls.
Add modifiers
Choose between a variety of modifiers to conduct a wide range of what-if scenarios for the entire portfolio
Configure load modifiers, electrification modifiers and billing options
Load modifiers include load shift, load adjustment or critical peak events to model the impact of usage changes
Electrification modifiers models the adoption of a variety of clean energy products
Billing options can be customized for programs and billing discounts
Support for modifier stacking to inform the overall impact of applying more than one modifier
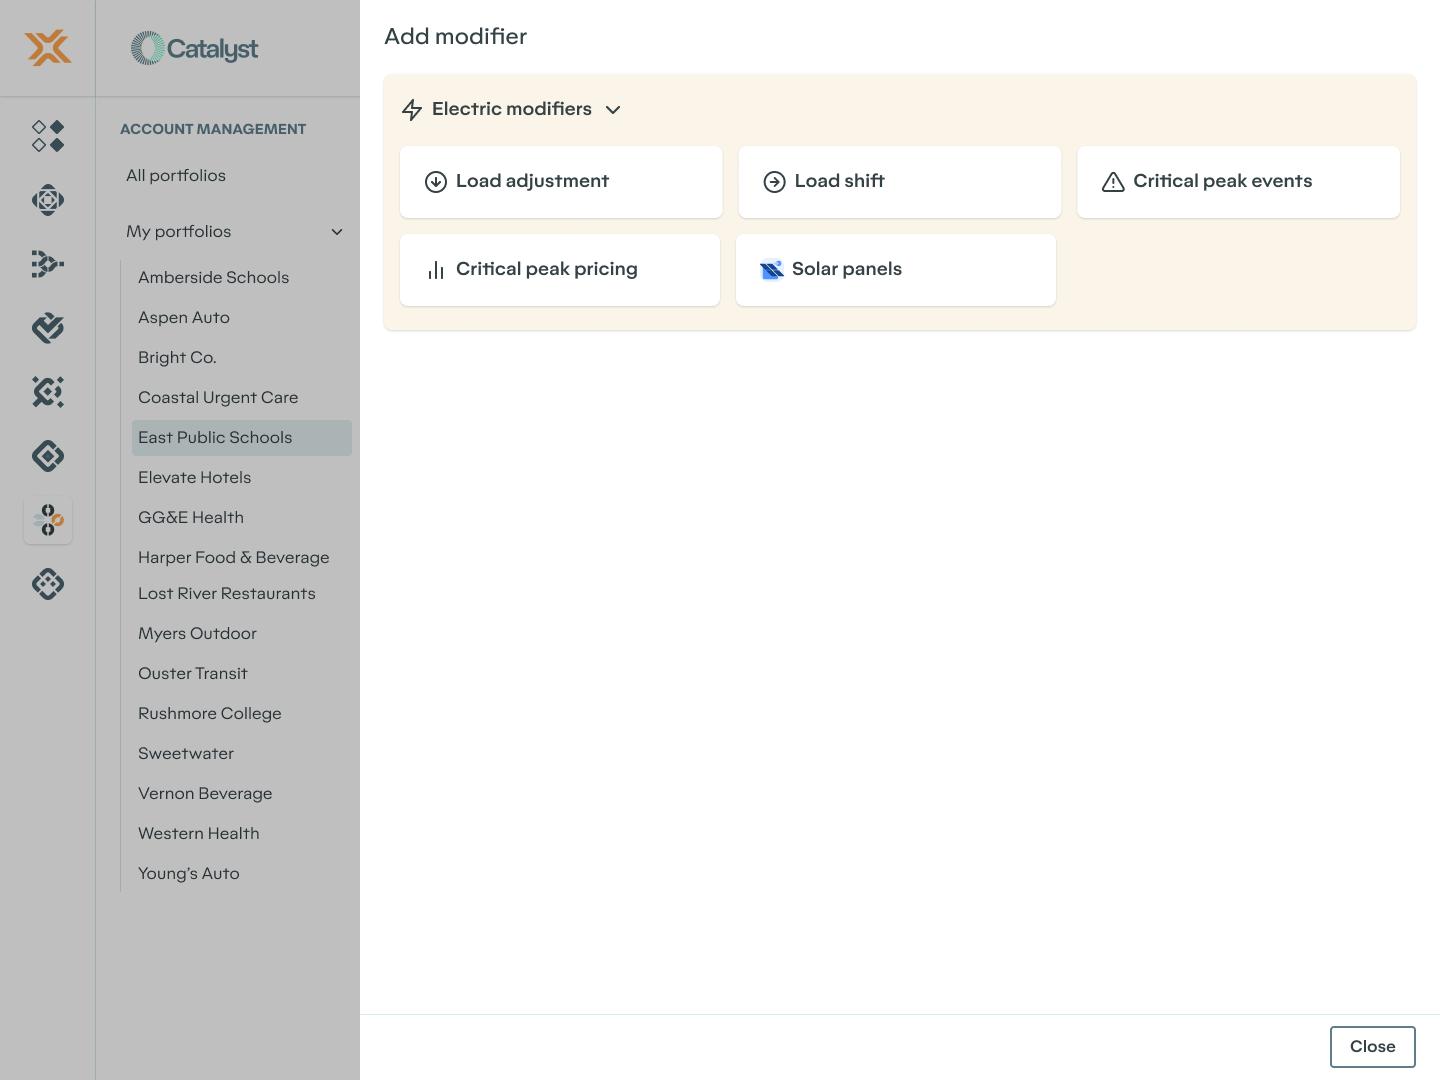
Side sheet with modifier options to add to your analysis.
Load Shift Configuration
Model a load shift for all accounts within a portfolio
Configure the size of the shift
Choose to shift load based on time or TOU buckets derived from your rates
Move energy usage from Peak to Off Peak depending on each account's rate definition
Select season if applicable
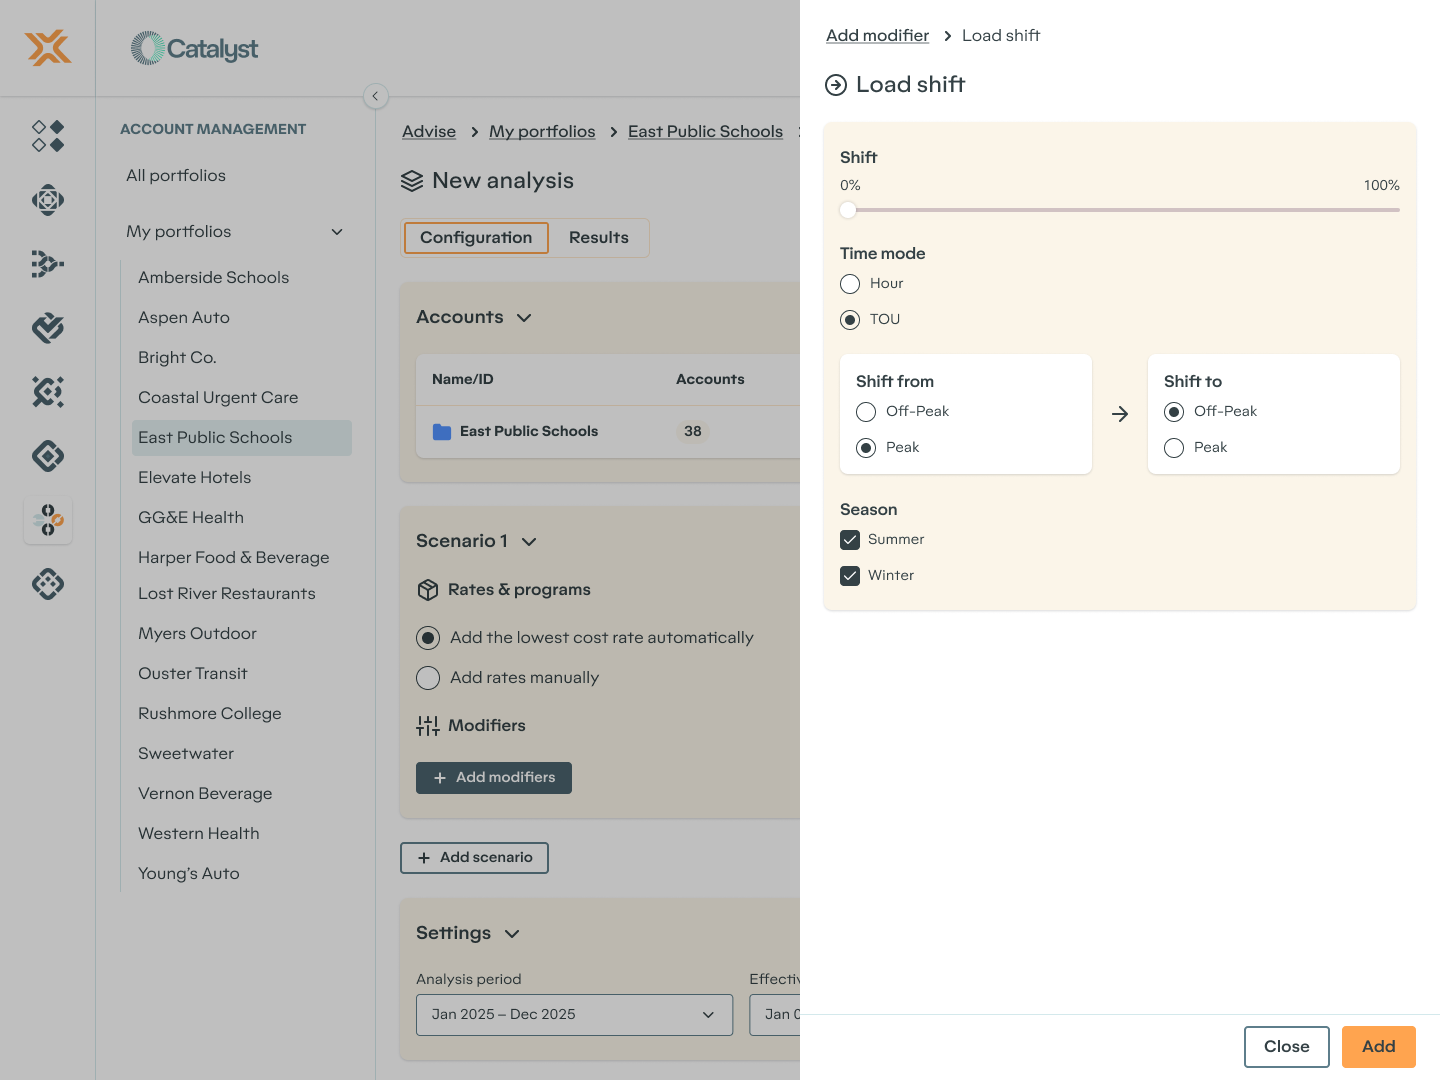
Side sheet with load shift configuration controls.
Results
Comprehensive results aggregated for all portfolio accounts
Result of the load shift provided by Usage and Cost
View impact by Year, Month or Day
Chart provides a reference line for baseline before load shift changes were applied to better visualize the impact of a coordinated load shift for all portfolio accounts
List view of all accounts within the portfolio included in the analysis
Details of the impact on each account listed on the Results page
Sort or filter the results to highlight opportunities within the portfolio to save money, change rates or adopt programs
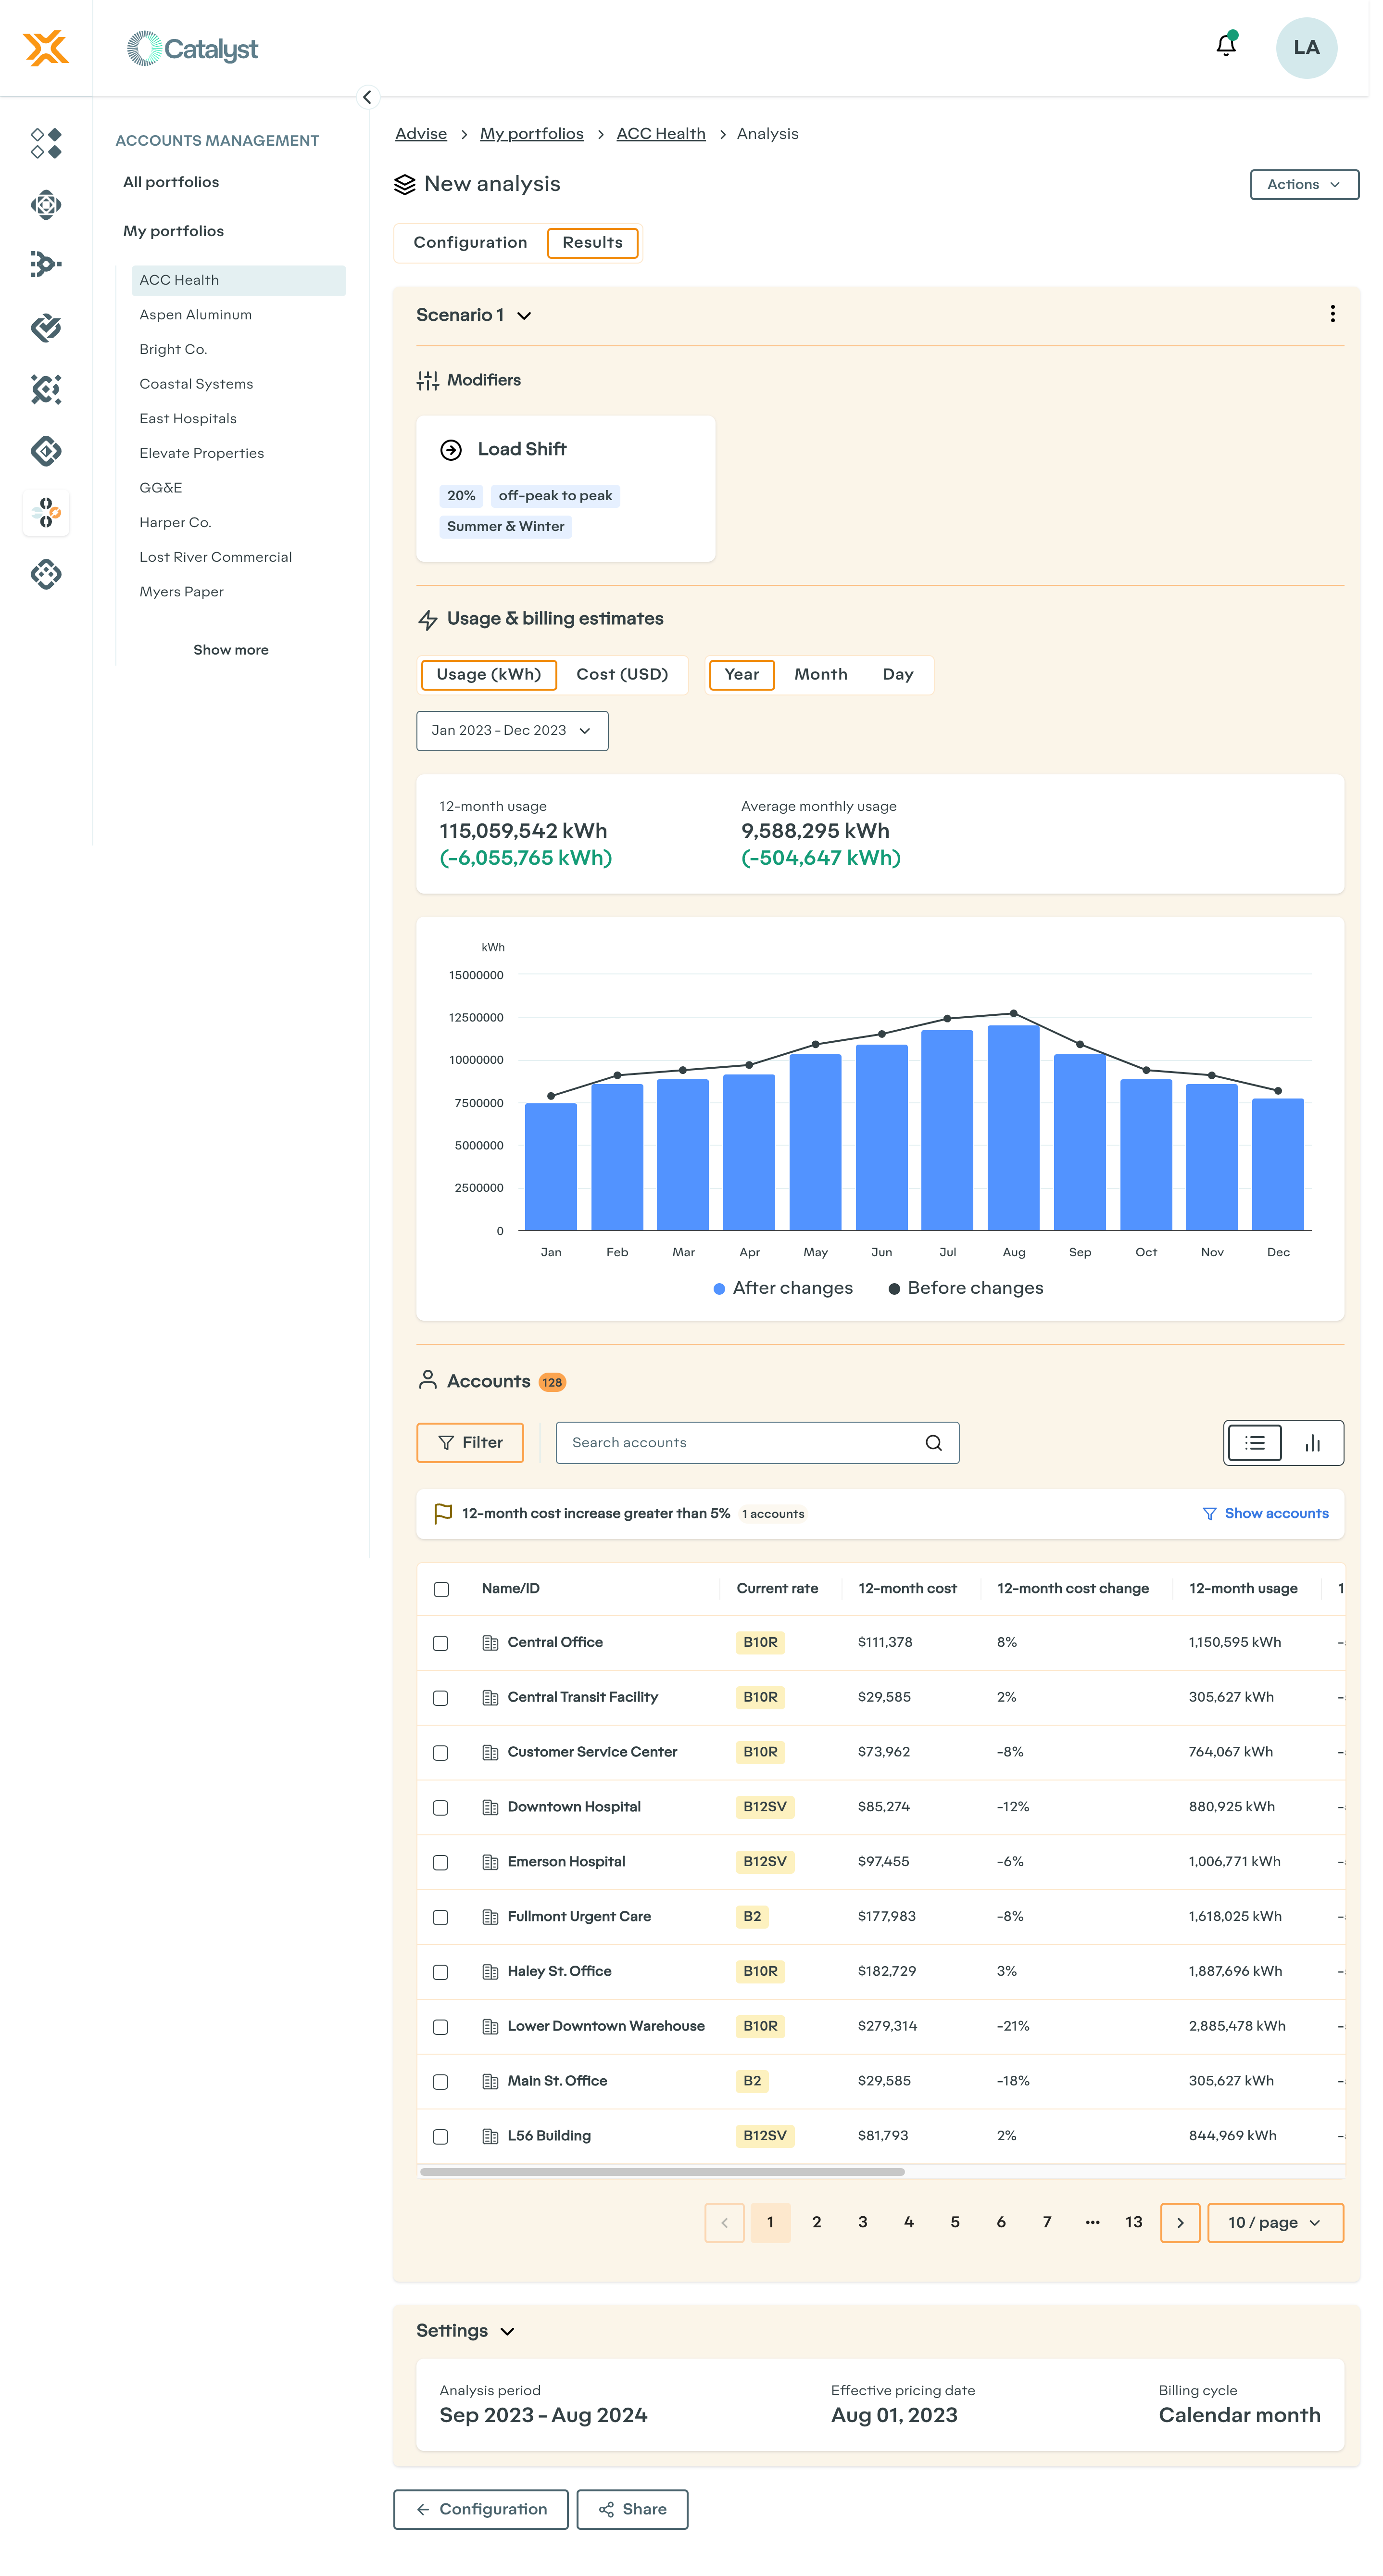
Analysis result page.